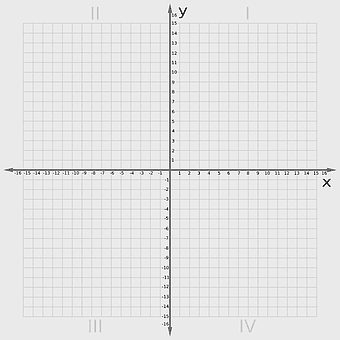
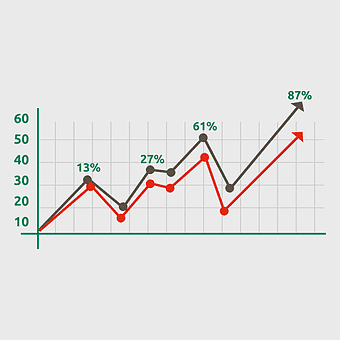
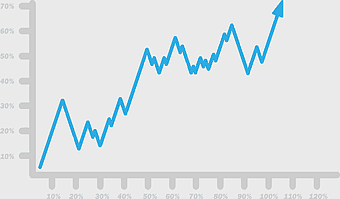
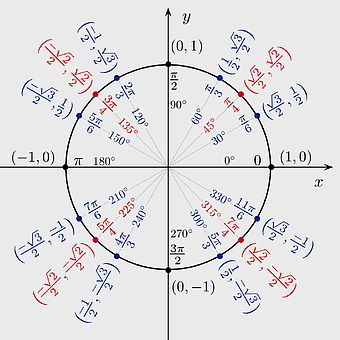
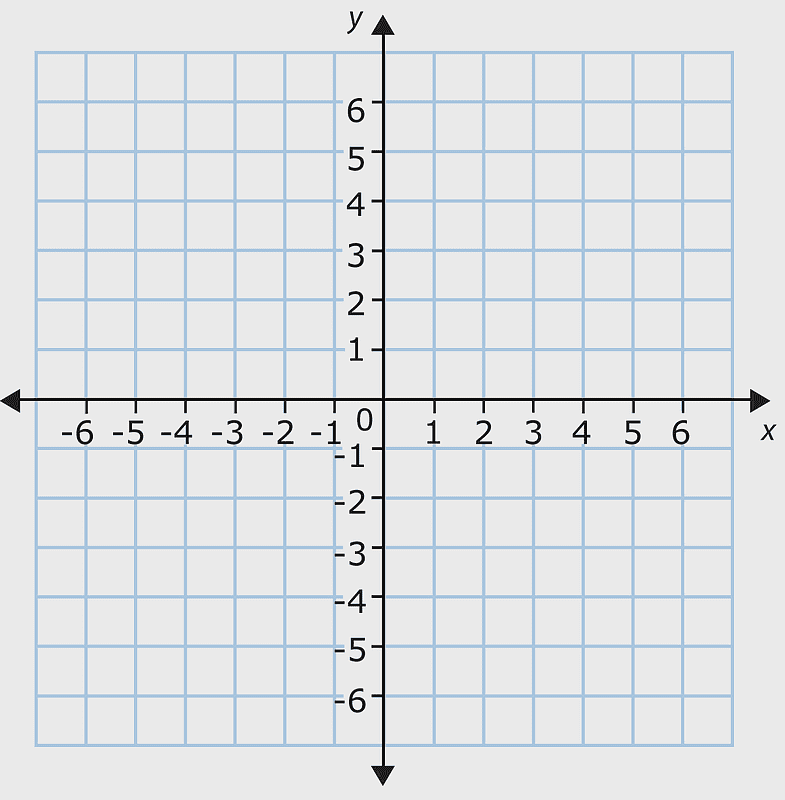
Cartesian coordinate system plane, graph of a function diagram, coordinate system grid, quadrant worksheet, algebraic graph analysis, mathematical plotting tool, geometric coordinate visualization, PNG
keywords
- cartesian coordinate system plane
- graph of a function diagram
- coordinate system grid
- quadrant worksheet
- algebraic graph analysis
- mathematical plotting tool
- geometric coordinate visualization
License: Personal use only
More related PNGs
-
3300x2550px

graph paper grid, Cartesian coordinate system plane, rectangle symmetry worksheet, bar chart continuation, geometric pattern analysis, educational math tools, plotting points template -
800x800px

Cartesian coordinate system, graph paper, plane geometry, mathematics worksheet, coordinate plotting, algebraic functions, geometric shapes analysis -
6354x6354px

mathematics geometry formulas, euclidean equations, triangle symmetry, monochrome design, geometric shapes analysis, algebraic expressions, educational diagrams, mathematical notations -
1080x763px

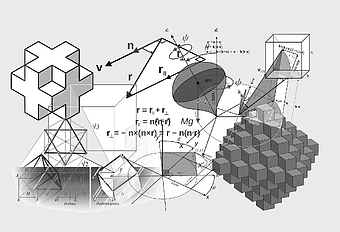
mathematical equations illustration, graph of a function, mathematical physics, black and white diagram, algebraic expressions, calculus formulas, geometric shapes -
4050x4050px

Euclidean geometry formulas, math shapes and equations, triangle and circle diagrams, graph of a function plots, geometric shapes analysis, mathematical concept illustrations, educational math visuals -
3500x3313px

mathematical formula, Euclidean geometry, functional equation, black and white diagram, algebraic expressions, geometric shapes, educational math visuals -
5556x7393px

graphing paper, squared school notebook, blue grid texture, textile pattern design, educational grid layout, academic plotting sheet, mathematical plotting grid -
1024x1024px

black and white grid, numerical digit chart, monochrome square pattern, decimal mathematics rectangle, geometric symmetry design, educational math visuals, grid-based number analysis -
918x670px

mathematical equations, Euclidean formula, geometric pattern shading, digital math draft, math function graph, algebraic expressions, trigonometric functions -
1501x1501px

black square grid, graph paper line chart, monochrome design, coordinate system plane, geometric pattern illustration, minimalist abstract art, structured layout background -
4050x4050px

Euclidean formula paper, mathematical formulas design, monochrome math artwork, line art diagrams, geometric equations, educational math graphics, algebraic expressions analysis -
1436x1111px

bar graph illustration, growth chart template, function diagram chart, yellow bar chart, data visualization design, business growth analysis, upward trend arrow -
4050x4050px

mathematics formula science pattern, purple mathematical notes, integral equation diagram, education math notes, advanced calculus equations, geometric shapes analysis, trigonometric functions study -
800x800px

mathematical equations, Euclidean geometry formulas, blue handwritten math, parallel lines diagram, algebraic functions graph, trigonometric identities, calculus limits explanation -
4520x3161px

handwritten mathematical equations, Euclidean geometry formulas, math class diagrams, function formula illustrations, educational math visuals, geometric shape equations, algebraic problem solving -
2244x2244px

mathematics formula algebra, euclidean geometry equations, monochrome mathematical symbols, handwritten math expressions, calculus integral notation, polynomial function analysis, limit theorem visualization -
500x500px

Graph paper grid, Cartesian coordinate system, black and white illustration, square symmetry, math diagram axis, geometric pattern artwork, plotting chart lines -
600x600px

equilateral triangle illustration, isosceles triangle geometry, black and white triangle art, regular polygon symmetry, geometric shape design, mathematical worksheet template, two-dimensional space analysis -
512x512px

line chart data visualization, bar chart market analysis, graph trend analysis, timeline data plot, statistical infographic design, business performance metrics, financial growth chart -
3500x3313px

mathematical formula study, educational common formula, math class begins, algebraic equations, calculus concepts, probability theory, geometric shapes analysis -
5869x8000px

calculator, numeric keypad, office equipment, computer algebra system, digital display, handheld device, mathematical functions -
4050x4050px

Euclidean mathematics equations, floating math problems, mathematical notes analysis, parallel line calculations, complex math visualization, educational graphing tools, advanced formula study -
512x512px

bar chart icon, statistical diagram, business data visualization, chart analysis, financial growth graph, infographic elements, data representation tools -
1024x768px

bar chart growth, graph of a function, online advertising design, diagram chart brand, data visualization trends, business analytics metrics, performance tracking tools -
1024x683px

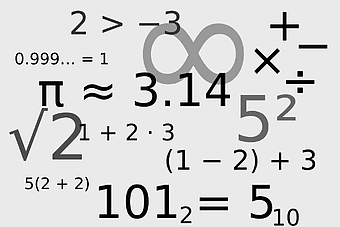
mathematical notation symbols, math symbols black and white, arithmetic symbols diagram, scalable math icons, algebraic expressions, mathematical equations, geometric symbols -
450x582px

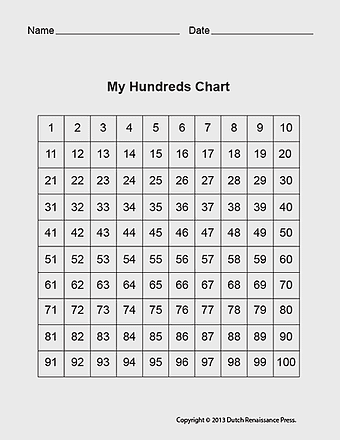
multiplication table chart, square number worksheet, 100 number grid, nonpositional numeral system, educational math visuals, elementary school resources, arithmetic learning tools -
1000x1000px

Principles and Standards for School Mathematics, mathematical notation, geometric shapes, algebraic symbols, STEM education visuals, math curriculum graphics, educational diagram illustrations -
2000x1268px

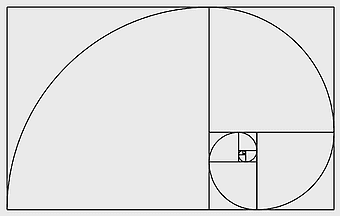
Golden ratio diagram, Fibonacci spiral illustration, mathematical symmetry, logarithmic spiral art, geometric proportion design, mathematical concept art, spiral structure analysis -
1000x1000px

square root symbol, mathematical notation, black and white math icon, long division symbol, algebraic function, geometric shape, mathematical operations -
800x800px

blue label background, graph of a function, geometric shapes, abstract shapes, mathematical diagram, function visualization, shape illustration -
609x488px

data analytics visualization, business process management, market research analysis, data processing tools, financial report analysis, strategic planning tools, information management systems -
1920x1308px

mathematics geometry formulas, trigonometry cube diagram, monochrome engineering shapes, perimeter point algebra, geometric structure analysis, mathematical education visuals, 3D shape illustrations -
1500x673px

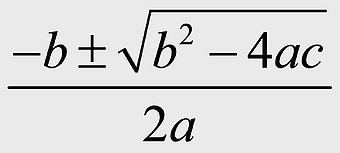
Quadratic formula equation, algebraic solution method, polynomial roots calculation, math education resources, quadratic function graphing, algebraic problem solving, mathematical formula analysis -
901x534px

mathematical function notation, integral calculus symbols, real-valued function graph, variable representation in math, algebraic expression design, calculus function illustration, mathematical identity visualization -
1100x869px

business finance color analysis, financial data visualization, economic growth charts, investment analysis graphs, market research diagrams, strategic planning tools, wealth management insights -
820x618px

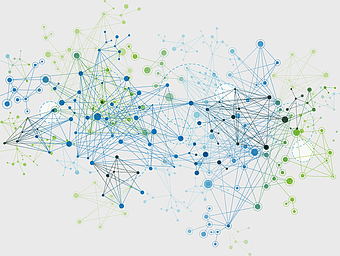
data mining visualization, big data network analysis, information technology graph, machine learning clusters, predictive analytics diagram, data analysis connections, bioinformatics network -
2250x2100px

magnifying glass analytics, market research data, predictive analytics insights, qualitative research analysis, data visualization tools, business intelligence graphs, strategic planning charts -
1462x1096px

isometric graph paper, triangle bisection worksheet, creative dotted line design, monochrome geometric shapes, patterned grid background, educational math visuals, symmetrical dot art -
500x667px

human lung anatomy, respiratory system illustration, heart and lungs diagram, bronchus structure, pulmonary function, thoracic cavity, medical imaging analysis -
1024x633px

Fibonacci sequence diagram, golden spiral mathematics, sacred geometry shape, spiral proportion analysis, mathematical sequence art, geometric progression illustration, fibonacci number pattern -
766x994px

mathematics textbook, algebra study guide, elementary math book, maths examination preparation, educational resource, arithmetic learning tool, geometric problem solving -
4119x2412px

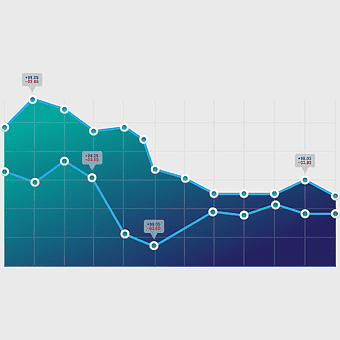
blue line trend chart, financial data analysis, stock market trend graph, blue abstract line plot, economic growth visualization, business performance metrics, technology trend analysis -
1152x778px

precalculus mathematics education, secondary school math concepts, algebraic geometry diagrams, math league competition problems, geometric shapes illustration, educational math tools, mathematical problem solving techniques -
768x768px

rectangle area, black line, geometric shape, angle measurement, mathematical diagram, educational illustration, visual geometry -
1600x1600px

unit circle diagram, trigonometric functions explained, pi radians chart, sine values visual, trigonometry educational graphics, coordinate system circle, math angle reference -
500x573px

data quality analysis, pattaya data analytics, data cleansing icons, communication diagram, data visualization tools, statistical analysis methods, business intelligence insights -
800x556px

quantitative research methods, market analysis tools, data collection techniques, business research diagrams, statistical analysis visuals, research methodology graphics, competitive market insights -
1024x855px

cash flow analysis, business investment chart, financial management diagram, accounting data visualization, economic growth trends, strategic planning tools, investment portfolio analysis -
807x400px

Network effect visualization, computer network diagram, internet connectivity graph, network layer analysis, digital network structure, online organization chart, data flow network -
445x609px

heart anatomy illustration, cardiovascular system diagram, circulatory system medical, vascular system sonography, human body blood flow, arterial network visualization, heart function analysis -
512x512px

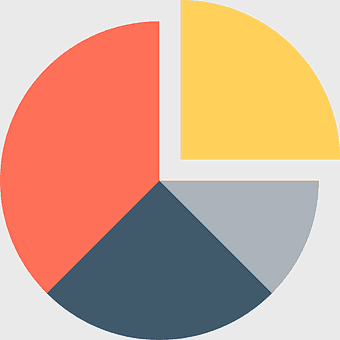
pie chart diagram, circle graph icon, orange and yellow segments, statistics visualization, data representation graphic, infographic element, visual analysis tool -
500x500px

market analysis diagram, business analytics logo, marketing strategy tags, market research service, data visualization tools, competitive analysis chart, industry trend analysis -
668x682px

mathematics number worksheet, elementary school numeracy, primary education math, subtraction and addition practice, abacus learning tool, colorful math visuals, educational math graphics -
2399x2400px

perspective grid geometry, geometric grid layout, line graph perspective, perspective grid design, 3D grid structure, visual depth grid, geometric pattern perspective -
500x571px

business growth bar chart, blue angle graph illustration, economic growth chart design, company progress visualization, financial trend analysis, data representation infographic, performance metrics diagram -
700x525px

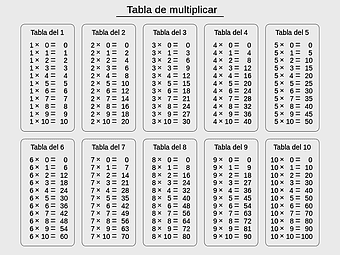
multiplication table, mathematical problem, learning mathematics, table of contents, educational math visuals, arithmetic study aids, numeric analysis tools -
614x561px

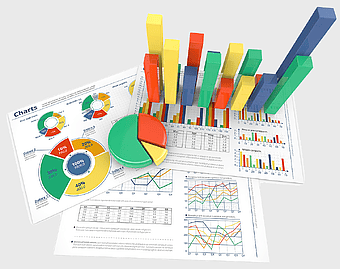
pie chart visualization, bar graph analysis, data presentation graphics, statistics research tools, financial growth charts, business analytics, infographic design elements -
800x618px

angle on graph paper, white text labels, geometric shapes diagram, line symmetry illustration, educational math visuals, basic geometry elements, plotting points guide -
3333x2500px

Graph of a function, market growth chart, bar chart visualization, stock market statistics, data representation diagram, financial trend analysis, business performance metrics -
800x621px

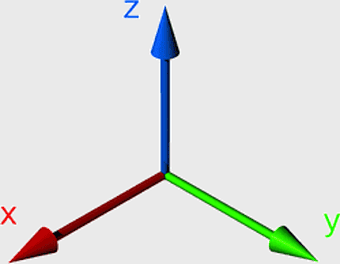
Cartesian coordinate system, three-dimensional space, XYZ axes, rotation diagram, spatial orientation, representation, geometric visualization -
2400x1800px

Business analytics dashboard, data visualization charts, performance management graphs, big data analysis, digital marketing insights, financial reporting tools, strategic business intelligence -
2000x4678px

digestive system diagram, gastrointestinal tract chart, human anatomy illustration, small intestine function, digestive process visualization, internal organ layout, metabolic system overview -
961x789px

human brain illustration, cerebrum structure, cartoon brain image, pink brain graphic, brain anatomy diagram, neural system visualization, cognitive function art -
2218x2216px

Graph of a function, Business Chart, telemarketing sales, line Chart, market analysis, data visualization, growth trend -
600x564px

Bar chart diagram, line graph visualization, gnuplot data representation, progress chart icon, statistical chart analysis, data visualization infographic, business organization graph -
1500x1500px

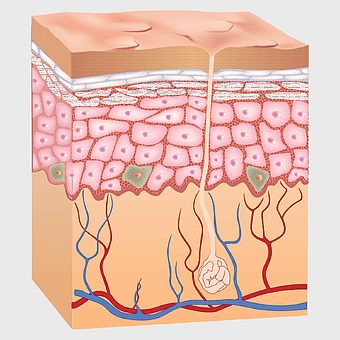
human skin anatomy diagram, stratum basale and corneum layers, epidermis and dermis structure, subcutaneous tissue illustration, skin cell regeneration process, human integumentary system, skin barrier function analysis -
1051x875px

accounting business financial statement, calculator with graphs illustration, office supplies for accountants, cost accounting analysis, financial data visualization, business management tools, audit and financial reporting -
1280x853px

Growth Chart, Progress Analysis, Achievement Graph, Increase Diagram, Business Metrics, Data Trending, Success Visualization, png -
1024x1024px

Fatality Analysis Reporting System icons, computer report symbols, black and white business charts, diagram analysis logo, data visualization graphics, statistical report, infographic elements design -
650x591px

graph of a function, bar chart, data analysis, statistics, visual data representation, infographic elements, business metrics -
512x512px

line chart economy, finance diagram icon, business arrow symbol, yellow circle graph, economic trend analysis, financial growth visualization, data representation chart -
539x563px

mathematics symbols, teacher learning tools, multiplication worksheet, addition study skills, educational icons, math classroom visuals, arithmetic operations graphics -
1800x1800px

line chart graph, statistical data visualization, curved lines diagram, abstract line art, trend analysis chart, financial data graph, energy performance metrics -
1285x857px

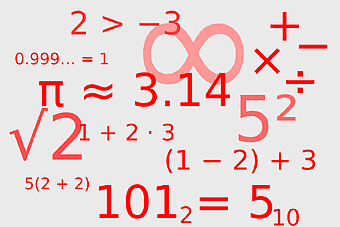
mathematical symbols, algebraic expressions, geometric formulas, mathematical notation, math problem solving, educational math graphics, math equation visualization -
1917x1466px

chemical compound structure, organic molecule diagram, benzyl group chemistry, molecular formula analysis, aromatic ring compound, functional group visualization, chemical synthesis process
