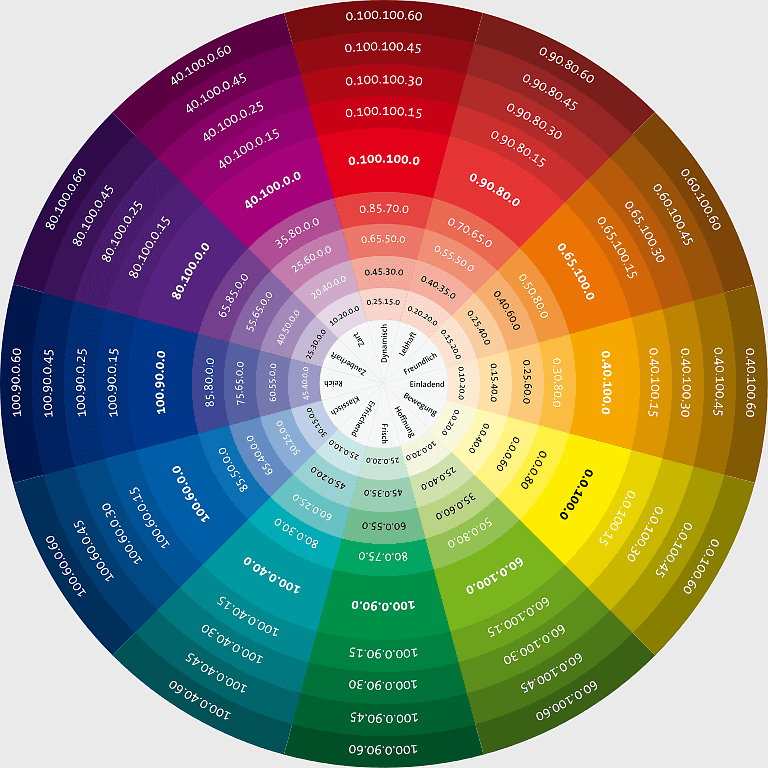
Color wheel diagram, CMYK color model chart, complementary colors circle, RGB Color Model sphere, color theory infographic, artistic color palette, visual design spectrum, PNG free download
color wheel diagram, CMYK color model chart, complementary colors circle, RGB Color Model sphere, color theory infographic, artistic color palette, visual design spectrum
More related PNGs
1318x1439pxInfographic chart icon, creative PPT element, assorted-color line illustration, information label, visual data representation, presentation graphics, design template, analytical diagram
1042x1057pxppt chart, color material, square area, info text, presentation template, infographic design, visual layout, diagram structure
1084x620pxgeometric options chart, layered infographic design, bright color sequence, triangle number layout, visual data representation, structured information graphic, modern product diagram, digital presentation elements
1200x1570pxCMYK color model illustration, paint splatter design, watercolor splash art, bright color patterns, artistic liquid flow, vibrant paint effects, creative graphic elements, dynamic visual composition
935x884pxbusiness template infographic, color chart diagram, digital classification chart, multi-colored cellular chart, hexagonal data visualization, infographic design elements, technology icon layout
568x755pxstartup company infographic, creative PPT lightbulb, magenta electric blue chart, 3D information diagram, innovative business concept, visual presentation element, startup idea visualization
510x511pxinformation infographic design, colorful circle chart, business data visualization, presentation slide elements, infographic template layout, circular diagram graphics, statistical data representation
3508x2480pxpurple abstract background, orange triangle design, magenta geometric pattern, abstract art chart, colorful polygonal backdrop, vibrant digital wallpaper, modern artistic visuals
2903x2693pxassorted-color boards, PPT Chart infographic, 3D information labels, data analysis options, visual presentation elements, infographic design templates, chart analysis tools
1024x1024pxred circle, orange sphere, education science visuals, red point, circular shape design, minimalist geometric art, vibrant color graphics
1600x889pxlens flare effect, white lens flare, Adobe After Effects editing, RGB color model, optical light effect, digital art illustration, creative visual design
1315x1206pxPie chart infographic template, 11 options infographics illustration, Wai circle infographic elements, color chart communication, circular data visualization, infographic design elements, presentation layout design
1000x981pxcircle infographic PPT, message and gears icons, bulb and globe symbols, people icon design, communication diagram elements, technology info chart, business presentation visuals
1000x1000pxassorted-color columns illustration, classification labels, ppt element of classification, data classification, infographic design elements, visual data representation, chart icon design
1181x1181pxinfographic arrow design, 3D arrows infographic, step-by-step infographic template, red arrow infographic, process flow diagram, visual presentation elements, business process chart
626x626pxcircle infographic templates, assorted-color circle frames, chart flyer design, classification diagram circles, infographic circle backgrounds, circular presentation elements, thematic circle layouts
2175x2282px5-step presentation template, Dispatched labor PowerPoint icon, info elements design, sequence chart diagram, step-by-step infographic, process flow visualization, multi-stage layout design
2206x959pxCMYK color model, printing paint, magenta paint splash, visual design elements, color theory illustration, graphic design resources, paint color spectrum
3138x4616pxPPT element, six assorted-color round, timeline pattern, information chart, colorful infographic design, circular data visualization, thematic presentation graphics
1000x1000pxinfographic diagram presentation, simple steps chart, business arrow design, ppt element arrows, step-by-step guide, visual flow chart, numbered process layout
1000x1000pxorange ring flame illustration, Light Fire RGB color model, ring of fire graphic, fire effect design, digital flame art, creative fire visuals, burning circle icon
512x512pxbar chart icon, statistical diagram, business data visualization, chart analysis, financial growth graph, infographic elements, data representation tools
500x500pxcolor wheel illustration, primary color circle, color theory diagram, web color picker, rainbow spectrum chart, artistic color palette, digital color wheel
1200x1195pxButterfly CMYK color model, happy holi floral design, colorful butterfly art, symmetry in nature, vibrant insect illustration, festive butterfly pattern, artistic pollinator depiction
730x730pxcolor wheel illustration, complementary color scheme, RGB color model, web color chart, color harmony design, spectrum circle graphic, chromatic sphere diagram
1181x1181pxLight White RGB color model, real sun bright ball, purple texture, circle pattern, celestial body, radiant glow, digital art design
502x500pxcolor wheel design, analogous color scheme, monochromatic color palette, complementary color chart, chromatic circle art, color theory infographic, hue spectrum visualization
594x887pxcreative light bulb infographic, world map design element, presentation logo elements, information chart symbol, global idea concept, innovative world map icon, data visualization bulb diagram
2400x2399pxcolor wheel diagram, complementary color pairs, primary color circle, analogous color scheme, color theory chart, spectral color gradient, color harmony guide
800x800pxmodel of the atom, atomic theory illustration, bohr model diagram, atomic structure visual, quantum mechanics concept, electron orbit depiction, nuclear physics graphic
1101x1117pxInfographic Flowchart Diagram, EPS shape logo, yellow blue circle chart, business presentation material, graphic design, infographic template, circular diagram layout
1400x1400pxcolor wheel flower, interior design color theory, cmyk color palette, complementary color scheme, rainbow flower art, symmetrical color design, tertiary color spectrum
1024x1024pxFatality Analysis Reporting System icons, computer report symbols, black and white business charts, diagram analysis logo, data visualization graphics, statistical report, infographic elements design
512x512pxInstagram logo white, neon Instagram icon, business hotel Devillas, RGB color model, social media branding, digital marketing visuals, online hospitality icons
568x561pxcolor wheel gradient circle, magenta red green spectrum, complementary color scheme, angle line drawing, rainbow color palette, artistic color mixing, educational color diagram
768x916pxmulticolored flowchart diagram, arrow Euclidean flowchart, step-by-step infographic, digital information template, visual process chart, sequential data presentation, creative business flow
1200x1062pxinfographic design template, circular data chart, technology workflow diagram, hanging icon circles, visual information flow, circular presentation elements, infographic circle templates
2000x2000pxcolorful circle frame, gradient border texture, trendy color wheel, simple symmetry design, abstract circular art, vibrant ring graphic, pastel spectrum circle
1498x2048pxCMYK color model tree, RGB color space illustration, multicolored silhouette design, color chart art, digital printing colors, graphic design education, visual art concepts
1000x1000pxCircle infographic chart, PPT information design, digital data visualization, business statistics presentation, infographic elements layout, data classification diagram, technology presentation templates
3965x3965pxcolor wheel design, complementary color scheme, watercolor painting techniques, color theory palette, artistic color harmony, vibrant color spectrum, digital color mixing
1024x1024pxblack and white circle, monochrome gradient, computer-generated image, RGB color model, abstract geometric design, digital art, minimalist visual
1956x2307pxyellow infographic template, step-by-step diagram, business presentation element, timeline chart design, colorful flowchart illustration, professional slide graphics, visual data representation
1000x731pxinfographic design template, business communication diagram, technology organization chart, yellow area line illustration, visual data representation, process flow graphic, circular information layout
726x996pxinfographic diagram template, 3d arrows business, roll up arrow icon, bar chart design, step-by-step guide, visual presentation tools, infographic elements layout
3616x2967pxcolor diamond infographic, business process chart, classified label template, information chart design, workflow diagram icon, visual data representation, step-by-step process illustration
739x739pxround infographic logo, creative PPT design element, color symmetry chart, information diagram layout, vibrant circle graphic, presentation visual aid, infographic color wheel
1524x1680pxorganizational chart infographic, staggered business information chart, assorted color texts, business data visualization, infographic design elements, step-by-step business presentation, corporate information layout
1024x1024pxcolorful stars dynamic light effect, orange red sparkles design, luminous flux RGB color model, light luminous efficacy stars, festive starburst pattern, vibrant star illustration, dynamic light art visuals
4961x7016pxinfographic chart diagram illustration, business design elements, step-by-step process flow, classification and labeling icons, circular infographic template, visual data representation, presentation slide graphics
1227x1605px3 options infographic, ppt chart circle, step-by-step process, ppt material design, visual communication flow, infographic template, circular diagram layout
1434x637pxHSL color model, HSV color space, CMYK color model, monochrome sphere, color theory illustration, digital color gradients, atmospheric color effects
1000x1000pxinfographic design elements, business process chart, digital data visualization, ppt template elements, step-by-step infographic, process flow diagram, presentation layout design
7012x5452pxPPT flow chart template, creative infographic design, multimedia presentation element, technology chart diagram, business process visualization, data analysis layout, professional slide design
512x512pxRGB color model logo, tricolor sphere, additive color mixing, RGB color wheel, color theory diagram, primary color interaction, visual color representation
714x585pxcolor wheel illustration, multicolored abstract ring, vibrant Splash ring design, colorful paint Splash effect, artistic spray ring, spectrum circle artwork, kaleidoscope art pattern
512x512pxline chart economy, finance diagram icon, business arrow symbol, yellow circle graph, economic trend analysis, financial growth visualization, data representation chart