financial analysis PNG, stickers, cliparts, transparent illustration & graphics
1000x700px
media planning strategy, advertising campaign analysis, business marketing tools, financial planning visuals, data-driven decision making, target audience engagement, corporate branding elements
2500x1875px
growth increase illustration, 3D arrows, business information service, histogram side view, financial growth chart, economic progress visualization, data analysis graph
2083x2083px
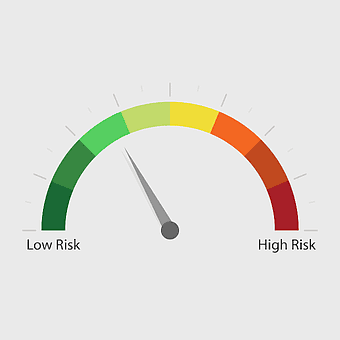
risk gauge diagram, investment credit risk management, exchange-traded fund risk analysis, counterparty risk indicator, financial risk assessment tool, market risk visualization, security investment metrics
600x600px
cost reduction icon, finance money symbol, yellow computer logo, expense analysis graphic, budget optimization design, financial planning image, economic efficiency illustration
600x564px
economy icons, financial market analysis, economic impact diagrams, flat design economy symbols, global finance visuals, business strategy graphics, economic growth indicators
1181x1181px
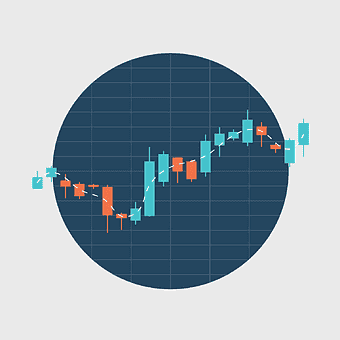
Day trading chart, market sentiment analysis, forex trading strategies, stock market volume, financial data visualization, investment trends graph, trading platform interface
2083x2083px
corona virus economic impact, inflation trends, financial downturn, economic recovery, global pandemic effects, monetary policy changes, market volatility analysis, png
3333x2500px
Graph of a function, market growth chart, bar chart visualization, stock market statistics, data representation diagram, financial trend analysis, business performance metrics
1024x780px
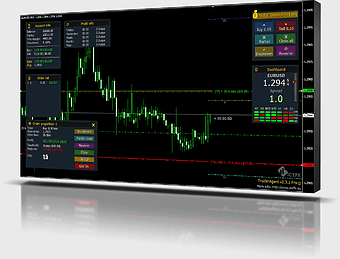
MetaTrader 4 trading platform, algorithmic trading strategies, foreign exchange market analysis, candlestick chart trading, financial market software, real-time trade monitoring, electronic trading systems
980x980px
stock market chart, financial market analysis, investment growth symbol, bar chart visualization, economic trend indicator, asset valuation graph, monetary performance metric
840x561px
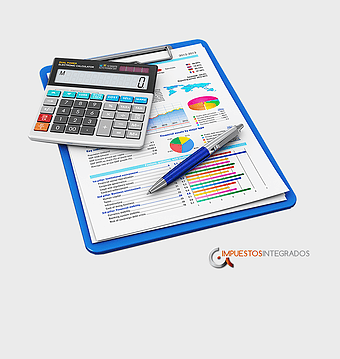
Bookkeeping Accounting software, Accounting information system, Tax preparation services, financial data analysis, business financial management, office productivity tools, professional accounting tools
1987x2115px
line graph finance, blue market analysis chart, stock market trend, financial information diagram, economic growth visualization, investment performance metrics, market data analytics
577x433px
bull market, bear market, green bull, red bear, financial trends, market indicators, investment analysis, png
1920x909px
market index trends, stock market performance, investment growth analysis, market capitalization graph, financial chart visualization, economic data representation, trading indicator analysis
1600x1600px
accounting software icon, CPA financial tools, balance sheet analysis, tax management services, financial data visualization, business calculation tools, audit process illustration
640x473px
frustrated financial advisor, stock market trader stress, business management challenges, technical analysis difficulties, corporate communication issues, professional burnout, investment strategy setbacks
976x694px
red up arrow chart, economies of scale diagram, economic growth visualization, ppt business presentation, financial trend analysis, strategic management graphic, productivity enhancement illustration
5698x3447px
stock market analysis, financial growth illustration, businesswoman presenting data, upward trend chart, investment insights, economic visualization, digital finance concepts, png
533x533px
ROI for real estate, real estate investment growth chart, financial return strategies, payback period analysis, investment performance metrics, property investment returns, wealth growth visualization
800x505px
foreign exchange market profit trends, stock trading strategies analysis, registered investment adviser financial growth, binary option price increase, investment graph performance, market trend forecast charts, finance strategy visual data
512x512px
business report icon, financial analysis chart, green organization logo, diagram signage, data visualization graphic, corporate branding symbol, report document illustration
1024x1024px
investment finance graph, high-yield investment program, seed money growth, financial adviser analysis, investment strategy visualization, money management tools, portfolio performance tracking
750x447px
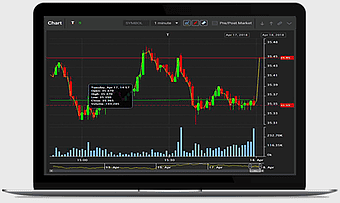
electronic trading platform, options strategies, day trading software, trading account assets, financial chart analysis, real-time stock trading, online investment tools
1181x1181px
business technology illustration, financial market analysis, corporate communication visuals, equity investment trends, digital workforce collaboration, data-driven business strategies, tech-driven professional networking
5387x2962px
forex candlestick charts, flat diagram outline, trading backdrop, candlestick analysis, financial market trends, stock chart patterns, investment strategy tools, png
480x597px
Standard Poor's logo, Standard Poor's rating, financial credit analysis, credit rating agency, cartoon character illustration, financial market insights, economic evaluation tools
876x548px
data-driven business analytics, real estate investment statistics, digital marketing growth charts, plastic toy blocks for business concepts, financial data visualization tools, strategic management graphs, economic trend analysis techniques
512x512px
balance sheet diagram, financial balance scale, accounting budget graphics, cash flow statement illustration, financial report visualization, business finance infographic, audit balance analysis
1024x1024px
Excel logo green, Microsoft Excel application, spreadsheet software icon, Excel data analysis, office productivity tool, financial data management, business analytics software
658x1056px
ethereum market cap, cryptocurrency exchange logo, blue geometric design, crypto trading platform, blockchain technology symbol, digital asset icon, financial market analysis
599x600px
economic growth chart, GDP trend analysis, price level graph, economic development diagram, financial performance visualization, economic progress indicator, macroeconomic data representation
1646x745px
algorithmic trading strategies, quantitative analyst tools, automated trading systems, electronic trading platforms, financial market analysis, stock market trends visualization, high-frequency trading techniques
1920x1062px
blue financial growth chart, personal finance market analysis, stock market trend diagram, market growth visualization, economic progress graph, financial data representation, investment performance metrics
1280x934px
Chart Line, Upwards Trend, Stock Broker, Positive Diagram, Market Growth, Financial Analysis, Investment Performance, png
2324x2000px
banknotes and coins illustration, economic growth chart, mixed economy visualization, economies of scale diagram, financial market trends, currency and wealth representation, economic system analysis
3000x2500px
logo design, bear market, bull market, stock market trends, financial symbols, market analysis, investment icons, png
1732x1934px
book report document, annual report analysis, business report template, report card icon, financial data visualization, infographic presentation, corporate material design
1206x503px
Nubank Brazil logo, purple financial brand, startup company infographic, violet business design, digital banking innovation, fintech venture analysis, Brazilian tech ecosystem
1171x1090px
options strategies, binary option trading, foreign exchange market analysis, ladder of success in finance, digital trading platform, financial technology tools, cryptocurrency investment strategies
1024x768px
revenue management icons, yield management sales, money increase graph, business profit analysis, financial growth chart, economic performance metrics, strategic pricing tools
1000x1056px
management accounting services, financial statement analysis, cost accountant tools, office equipment for bookkeeping, financial data visualization, business budget planning, professional accounting resources
800x800px
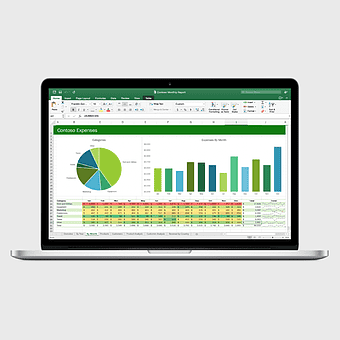
microsoft excel pivot table tutorial, xls data processing visualization, expert microsoft material presentation, spreadsheet training course report, business analysis dashboard, financial analytics software, revenue tracking system
512x512px
candlestick chart analysis, Bollinger Bands trading, foreign exchange market trends, trader technical indicators, financial market visualization, stock chart patterns, investment strategy tools
512x512px
dollar sign chart, sales diagram icon, market bar chart, stock market symbol, financial growth illustration, economic trend analysis, investment performance graphic
1280x934px
Trend line graph, market growth chart, business trend analysis, financial growth diagram, economic progress visualization, stock market trajectory, upward trend indicator
900x743px
credit score improvement, FICO score diagram, personal finance growth, blue bar graph, financial progress chart, creditworthiness visualization, economic trend analysis
1300x1600px
risk management analysis, red risk cubes, magnifying glass inspection, financial risk assessment, strategic decision tools, investment scrutiny, enterprise risk visualization
939x660px
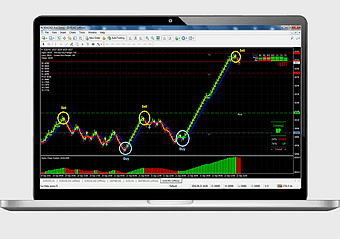
Renko charts in MetaTrader 4, forex price action trading, technical indicator for scalping, renko chart analysis, financial market analysis software, trading platform interface, currency exchange rate visualization
800x374px
Foreign Exchange Market analysis, price action trading strategies, trader focusing on market trends, automated trading system insights, financial market visualization, investment risk assessment, electronic trading platform interface
644x389px
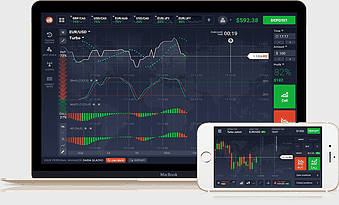
binary option trading strategies, automated trading system software, electronic trading platform display, financial market analysis tools, investment technology solutions, online brokerage services, multimedia finance applications
897x441px
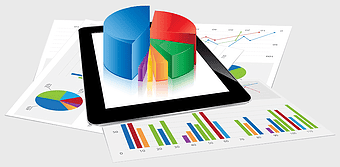
3D pie chart on tablet, layered graph visualization, material statistics chart, plastic 3D technology trends, financial data analysis, digital graph representation, market research insights
1280x960px
Data visualization, financial growth chart, investment graph, profit increase, economic trends, market analysis, business performance metrics, png
1202x1155px
investment analyst cartoon, business investment presentation, financial data visualization, money bag illustration, economic growth chart, professional investor analysis, cartoon finance presentation
819x408px
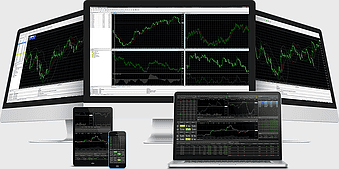
forex trading platform, electronic trading system, computer monitor display, currency market analysis, financial data visualization, trading software interface, multi-device trading setup
1326x591px
foreign exchange market data visualization, purple magenta infographic design, algorithmic trading analysis chart, information result diagram, financial market trends graph, statistical evaluation report, economic data presentation
1200x959px
mortgage calculator, real estate finance, amortization calculator, usda home loan, property investment analysis, home loan calculator tool, financial planning for homeowners
512x512px
reduction bar chart, investment decrease, red arrow icon, economy line graph, financial trend analysis, business performance metrics, stock market visualization
5556x5556px
smart chart illustration, e-learning company training, financial analysts meeting, technology training development, business presentation analysis, office team collaboration, mobile learning environment
1000x704px
green upward trend chart, green arrow growth visual, green rising bar increase, green progress indicator, financial growth graphic, positive trend analysis, bar chart accomplishment figure
850x850px
reduce cost chart, dollar sign icon, cost reduction graph, yellow dollar symbol, financial trend analysis, expense reduction illustration, budget management graphic


