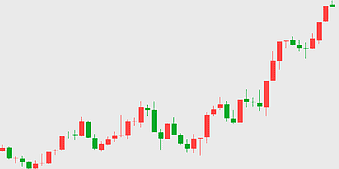
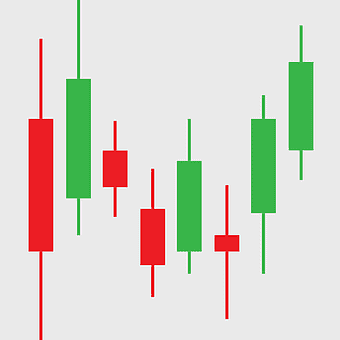
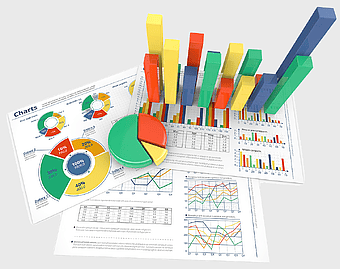
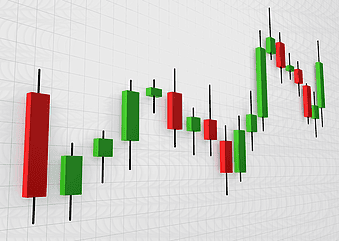
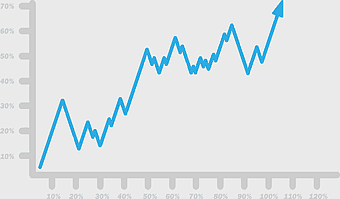
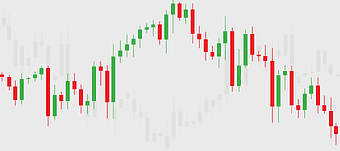
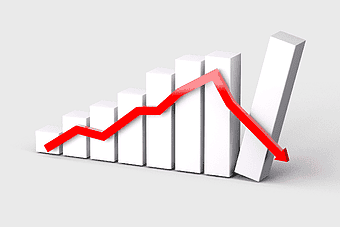
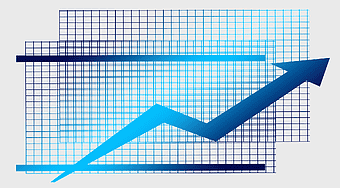
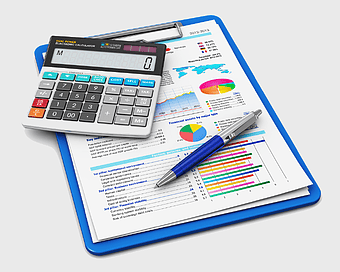
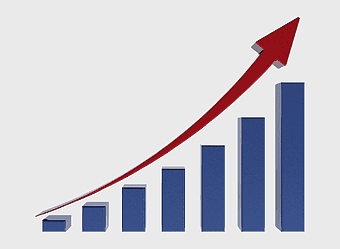
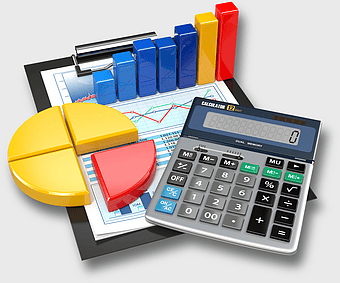
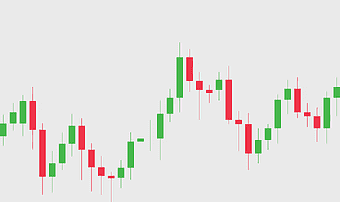
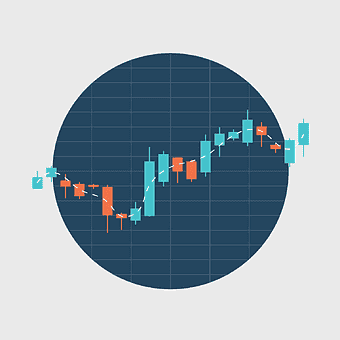
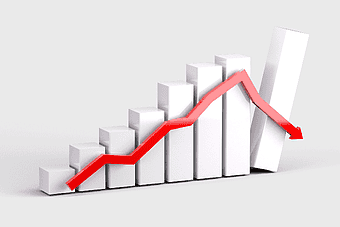
Finance market bull and bear, financial adviser investment strategies, asset management trends, stock market analysis, economic indicators visualization, financial planning tools, market performance graphics, PNG

keywords
- Finance market bull and bear
- financial adviser investment strategies
- asset management trends
- stock market analysis
- economic indicators visualization
- financial planning tools
- market performance graphics
License: Personal use only
More related PNGs
-
978x595px

Wall Street bull market, electric blue financial charts, stock exchange investment trends, seasonal market adjustments, economic growth indicators, financial data visualization, market analysis tools -
1024x855px

cash flow analysis, business investment chart, financial management diagram, accounting data visualization, economic growth trends, strategic planning tools, investment portfolio analysis -
4910x3493px

stock market arrows, dynamic financial charts, sketch market trends, growth decline indicators, economic visualization, investment analysis tools, market performance graphics, png -
5353x2966px

stock market arrows, flat design line chart, sketch market trends, financial growth indicators, economic data visualization, investment analysis tools, business performance metrics, png -
800x800px

Budget Investment cartoon, finance management illustration, asset allocation strategy, capital budgeting process, financial planning tools, business savings tips, economic decision-making visuals -
950x473px

Options strategies diagram, forex market analysis, stock trading chart, thinkorswim investment tools, candlestick pattern recognition, financial market trends, leverage trading strategies -
500x500px

binary option trading chart, day trading financial analysis, investment market trends, stock trade visualization, candlestick chart analysis, financial market patterns, trading strategy insights -
740x400px

finance investment growth, stock market analysis, financial market trends, money profit diagram, economic data visualization, investment strategy chart, capital market insights -
1100x869px

business finance color analysis, financial data visualization, economic growth charts, investment analysis graphs, market research diagrams, strategic planning tools, wealth management insights -
609x488px

data analytics visualization, business process management, market research analysis, data processing tools, financial report analysis, strategic planning tools, information management systems -
1324x900px

Business loan growth, money stack investment, financial services chart, unsecured debt management, wealth accumulation strategy, economic progress visualization, capital expansion trends -
778x647px

red zig zag arrow, market growth chart, stock market analysis, website branding, financial trend indicator, business performance graph, upward trajectory symbol -
1920x1357px

blue arrow up graph, economic growth analysis, finance performance indicator, sustainable development chart, upward trend visualization, financial progress metrics, economic development indicators -
980x980px

stock market chart, financial market analysis, investment growth symbol, bar chart visualization, economic trend indicator, asset valuation graph, monetary performance metric -
800x505px

foreign exchange market profit trends, stock trading strategies analysis, registered investment adviser financial growth, binary option price increase, investment graph performance, market trend forecast charts, finance strategy visual data -
502x549px

real estate investment, mortgage loan funding, property cash savings, home equity finance, real estate market trends, financial planning strategies, investment property analysis -
1600x1600px

real estate investing, finance, money, investment company, wealth accumulation, financial planning, asset management -
1000x710px

Candlestick chart pattern, Technical analysis for traders, Red and green stock bars, Open-high-low-close chart, Financial market analysis, Trading chart visualization, Stock market trend analysis -
696x606px

internal audit management, financial analysis tools, investment strategy planning, office supplies for finance, audit process visualization, financial risk assessment, business analytics equipment -
1280x905px

Trend analysis, currency fluctuations, stock market performance, trading strategies, financial market trends, investment analysis, economic indicators, png -
1080x792px

financial statement analysis report, management analytics chart, marketing data visualization, efficiency analysis diagram, business performance metrics, strategic financial planning, market trend analysis -
2000x1343px

Warren Buffett investment strategies, mutual fund market analysis, senior citizen financial planning, stock market index trends, business leadership insights, financial market expertise, investment fund management tips -
500x500px

red arrow options strategies, trader trading strategy market, red arrow finance diagram, stock market profit indicator, upward trend analysis, investment growth symbol, market performance visualization -
850x605px

binary option trading strategy, exchange market analysis, trader profit diagram, futures contract finance, investment growth chart, market trend visualization, financial performance metrics -
1987x2115px

line graph finance, blue market analysis chart, stock market trend, financial information diagram, economic growth visualization, investment performance metrics, market data analytics -
611x427px

Forex signal service, Foreign Exchange Market trader, investment growth chart, trading strategy analysis, financial market trends, economic data visualization, currency exchange insights -
800x923px

investment fund management, personal finance planning, financial advisor services, money transfer illustration, wealth management solutions, savings account growth, economic investment strategies -
1280x1280px

Forex trading chart, stock market analysis, candlestick pattern, financial exchange, market trend visualization, investment strategy, economic data graph, png -
670x515px

cost reduction strategies, financial management tools, business organization chart, sap erp solutions, budget planning visuals, expense tracking methods, corporate finance analysis -
1848x1703px

annual report analysis, business investment analytics, market analysis data, senior management report, financial performance metrics, corporate strategy insights, economic trend visualization -
4119x2412px

blue line trend chart, financial data analysis, stock market trend graph, blue abstract line plot, economic growth visualization, business performance metrics, technology trend analysis -
577x433px

bull market, bear market, green bull, red bear, financial trends, market indicators, investment analysis, png -
4181x3936px

stock market bull, bull market trend, golden bull symbol, upward market arrow, financial growth indicator, economic prosperity icon, investment optimism sign, png -
5461x2428px

forex trading chart, candlestick chart design, fluctuating market trends, trading backdrop, financial market analysis, stock market visualization, investment graph, png -
600x508px

Digital marketing growth chart, SEO performance graph, NIFTY 50 business trends, stock market increase diagram, financial progress visualization, economic development metrics, market analysis infographic -
800x553px

saving and investment growth, personal finance management, term deposit benefits, money investment strategies, financial planning tips, wealth accumulation techniques, coin-based savings plans -
500x500px

financial statement analysis, investment management tools, business financial planning, chief financial officer resources, accounting software interface, financial data visualization, corporate budgeting strategies -
1756x1762px

Arrow Market Graph, green stock market trend, upward financial chart, growth indicator, economic progress symbol, investment success graphic, positive market trajectory -
980x736px

bar chart icon, black and white graph, economic growth symbol, monochrome technology logo, data visualization graphic, business trend analysis, financial progress indicator -
1280x853px

economic recession graph, stock market crash diagram, financial volatility chart, economic downturn visualization, financial crisis trends, investment risk analysis, market performance decline, png -
500x500px

market analysis diagram, business analytics logo, marketing strategy tags, market research service, data visualization tools, competitive analysis chart, industry trend analysis -
1440x936px

financial growth chart, business revenue planning, investment management diagram, profit analysis checklist, financial strategy visualization, economic planning illustration, business analytics graphic -
1920x909px

market index trends, stock market performance, investment growth analysis, market capitalization graph, financial chart visualization, economic data representation, trading indicator analysis -
5698x3447px

stock market analysis, financial growth illustration, businesswoman presenting data, upward trend chart, investment insights, economic visualization, digital finance concepts, png -
512x512px

candlestick chart analysis, Bollinger Bands trading, foreign exchange market trends, trader technical indicators, financial market visualization, stock chart patterns, investment strategy tools -
980x902px

financial planning graph, business trend analysis, investment growth chart, monochrome financial logo, economic performance chart, budgetary data visualization, wealth management icons -
512x512px

financial statement chart, finance report icon, business presentation board, money organization graph, data visualization tools, economic growth analysis, corporate financial planning -
600x564px

economy icons, financial market analysis, economic impact diagrams, flat design economy symbols, global finance visuals, business strategy graphics, economic growth indicators -
512x512px

financial accounting charts, desktop office supplies, pie chart analysis, stock market statistics, business data visualization, electronic financial tools, accounting technology trends -
1590x543px

Bitcoin digital currency, cryptocurrency exchange logos, altcoin investment options, blockchain token coins, virtual money assets, digital finance tools, crypto market trends -
2251x1352px

saving trends, investment growth, gold coin stacks, economic development, financial progress visualization, wealth accumulation process, market prosperity indicators -
1920x1062px

blue financial growth chart, personal finance market analysis, stock market trend diagram, market growth visualization, economic progress graph, financial data representation, investment performance metrics -
1200x900px

dollar sign icon, revenue growth chart, business profit analysis, sales performance metrics, financial data visualization, economic trend analysis, magnifying glass finance -
1000x607px

investment calculation, stock market analysis, financial transactions calculator, investment compute study, financial data visualization, portfolio management tools, economic growth charts -
800x600px

gold investment growth, gold coin stacks, financial market trends, interest rate impact, wealth accumulation strategy, economic stability indicators, precious metal value analysis -
768x600px

Economy of Ukraine growth, Ukrainian financial development, investment opportunities in Ukraine, Ukrainian economic trends, financial progress visualization, wealth accumulation graph, economic prosperity indicators -
1024x819px

cost accounting analysis, financial management tools, office equipment for accounting, accounts payable management, business data visualization, financial report analysis, calculator for financial planning -
1024x1024px

investment finance graph, high-yield investment program, seed money growth, financial adviser analysis, investment strategy visualization, money management tools, portfolio performance tracking -
3000x2200px

red arrow growth chart, business development strategy, economic growth visualization, company sales progress, financial performance metrics, strategic planning tools, market expansion trends -
700x582px

financial report analysis, investment calculator tools, bank finance charts, office equipment for finance, financial data visualization, business analytics tools, money management graphs -
512x512px

money finance saving value, black and white piggy bank, monochrome investment icons, hand holding banknote, financial planning concept, wealth accumulation strategy, economic stability -
500x500px

investment growth chart, finance icons, money stack, business strategy, economic trends, financial planning, wealth accumulation -
5392x3202px

forex candlestick charts, flat business diagram, bright chart sketch, trading backdrop template, financial market analysis, stock market visualization, economic trend graph, png -
1181x1181px

Day trading chart, market sentiment analysis, forex trading strategies, stock market volume, financial data visualization, investment trends graph, trading platform interface -
2433x1521px

business plan visual representation, performance metrics chart analysis, marketing strategy infographic, economic growth graph, project management pie chart, data visualization insights, business analytics overview -
2000x2000px

Microsoft Excel logo, spreadsheet software icon, Microsoft Office suite, green Excel symbol, data analysis tool, business productivity app, financial planning software, document management system -
2400x1800px

Business analytics dashboard, data visualization charts, performance management graphs, big data analysis, digital marketing insights, financial reporting tools, strategic business intelligence -
1600x946px

economic growth trends, green economic indicators, global finance symbols, sustainable development economics, world economy visualization, financial health metrics, eco-friendly business strategies -
564x536px

rising financial chart, red profit graph, business growth illustration, investment performance metrics, economic trend analysis, market success visualization, corporate earnings trajectory -
998x612px

financial accounting services, bank loan management, electronic bookkeeping tools, stock market analysis, financial data visualization, business analytics dashboard, accounting software interface -
512x512px

dollar sign chart, sales diagram icon, market bar chart, stock market symbol, financial growth illustration, economic trend analysis, investment performance graphic -
1280x853px

Recession graph, market crash diagram, economic downturn visualization, volatile financial trends, financial crisis analysis, investment risk depiction, economic instability illustration, png -
1734x1604px

saving money illustration, hand holding cash, investment finance, money changer concept, financial planning tips, wealth accumulation strategies, economic growth visuals -
731x550px

goal illustration, business management diagram, technology communication circle, brand strategy target, strategic planning visuals, achievement concept art, target market analysis -
1600x1080px

business economics, green finance, sustainable organization, economic growth, global currency symbols, financial market trends, eco-friendly business practices
