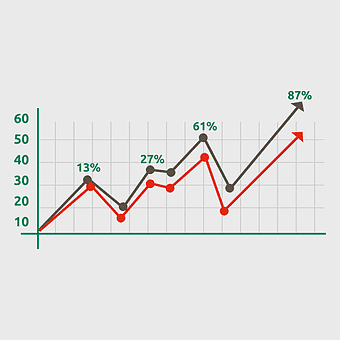
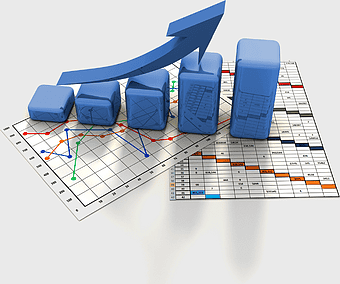
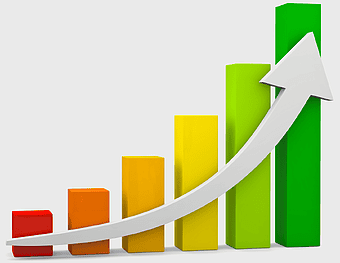
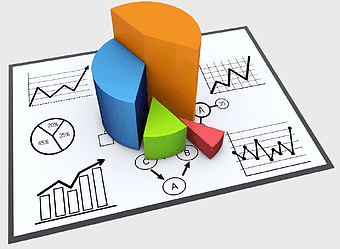
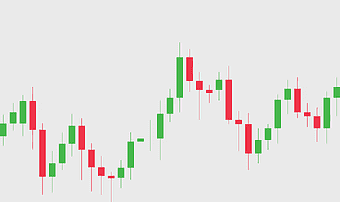
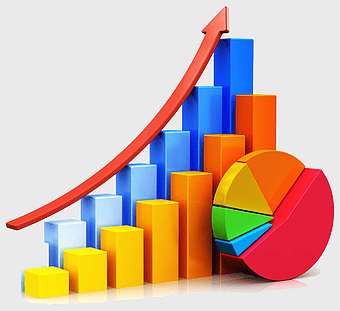
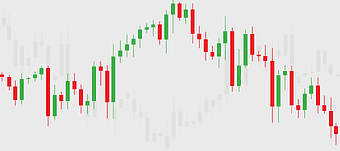
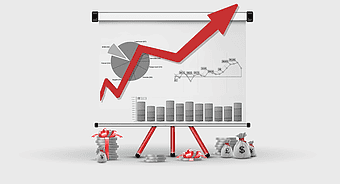
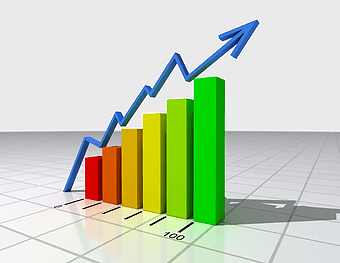
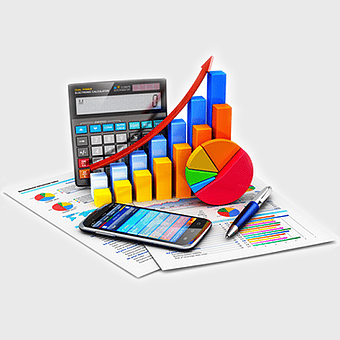
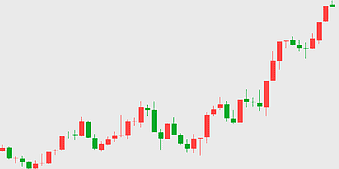
Digital marketing growth chart, SEO performance graph, NIFTY 50 business trends, stock market increase diagram, financial progress visualization, economic development metrics, market analysis infographic, PNG
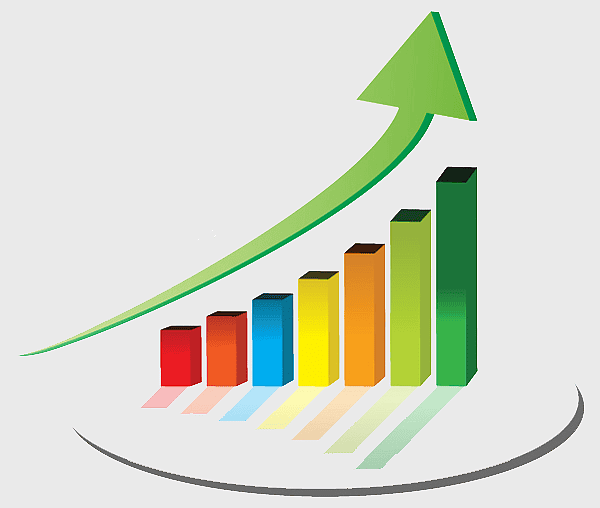
keywords
- Digital marketing growth chart
- SEO performance graph
- NIFTY 50 business trends
- stock market increase diagram
- financial progress visualization
- economic development metrics
- market analysis infographic
License: Personal use only
More related PNGs
-
500x571px

business growth bar chart, blue angle graph illustration, economic growth chart design, company progress visualization, financial trend analysis, data representation infographic, performance metrics diagram -
512x512px

line chart data visualization, bar chart market analysis, graph trend analysis, timeline data plot, statistical infographic design, business performance metrics, financial growth chart -
1592x1194px

business growth chart, conversion rate optimization, digital marketing graph, interest rate trends, financial progress visualization, economic development metrics, performance analysis chart -
1920x1357px

blue arrow up graph, economic growth analysis, finance performance indicator, sustainable development chart, upward trend visualization, financial progress metrics, economic development indicators -
778x647px

red zig zag arrow, market growth chart, stock market analysis, website branding, financial trend indicator, business performance graph, upward trajectory symbol -
5353x2966px

stock market arrows, flat design line chart, sketch market trends, financial growth indicators, economic data visualization, investment analysis tools, business performance metrics, png -
4119x2412px

blue line trend chart, financial data analysis, stock market trend graph, blue abstract line plot, economic growth visualization, business performance metrics, technology trend analysis -
980x736px

bar chart icon, black and white graph, economic growth symbol, monochrome technology logo, data visualization graphic, business trend analysis, financial progress indicator -
1280x853px

Growth Chart, Progress Analysis, Achievement Graph, Increase Diagram, Business Metrics, Data Trending, Success Visualization, png -
982x1000px

growth chart, economic development, bar chart, business development, financial progress, data visualization, upward trend -
1000x704px

green bar chart illustration, economic growth statistics, business performance metrics, rising arrow graphic, financial progress visualization, market trend analysis, data representation chart -
1200x1200px

digital marketing analytics, SEO strategy diagram, content marketing analysis, social media marketing insights, online business growth, data-driven marketing solutions, web performance optimization -
512x512px

bar chart icon, statistical diagram, business data visualization, chart analysis, financial growth graph, infographic elements, data representation tools -
1024x855px

cash flow analysis, business investment chart, financial management diagram, accounting data visualization, economic growth trends, strategic planning tools, investment portfolio analysis -
1436x1111px

bar graph illustration, growth chart template, function diagram chart, yellow bar chart, data visualization design, business growth analysis, upward trend arrow -
3333x2500px

Graph of a function, market growth chart, bar chart visualization, stock market statistics, data representation diagram, financial trend analysis, business performance metrics -
1324x900px

Business loan growth, money stack investment, financial services chart, unsecured debt management, wealth accumulation strategy, economic progress visualization, capital expansion trends -
1987x2115px

line graph finance, blue market analysis chart, stock market trend, financial information diagram, economic growth visualization, investment performance metrics, market data analytics -
1024x768px

bar chart growth, graph of a function, online advertising design, diagram chart brand, data visualization trends, business analytics metrics, performance tracking tools -
512x512px

green arrow graph, bar chart growth, analytics statistics, report diagram, data visualization, business trends, performance metrics -
933x979px

3D business chart, rising arrow graph, business analysis visualization, green bar chart, financial growth indicator, corporate success metrics, data trend analysis -
1080x792px

financial statement analysis report, management analytics chart, marketing data visualization, efficiency analysis diagram, business performance metrics, strategic financial planning, market trend analysis -
5392x3202px

forex candlestick charts, flat business diagram, bright chart sketch, trading backdrop template, financial market analysis, stock market visualization, economic trend graph, png -
1000x710px

Candlestick chart pattern, Technical analysis for traders, Red and green stock bars, Open-high-low-close chart, Financial market analysis, Trading chart visualization, Stock market trend analysis -
1280x934px

Trend line graph, market growth chart, business trend analysis, financial growth diagram, economic progress visualization, stock market trajectory, upward trend indicator -
1200x1200px

Sales growth chart, business profit symbol, marketing revenue icons, purchasing analytics graph, financial success indicators, corporate earnings visualization, economic performance metrics -
2433x1521px

business plan visual representation, performance metrics chart analysis, marketing strategy infographic, economic growth graph, project management pie chart, data visualization insights, business analytics overview -
980x980px

stock market chart, financial market analysis, investment growth symbol, bar chart visualization, economic trend indicator, asset valuation graph, monetary performance metric -
512x512px

line chart, multicolored graph, data visualization, trend analysis, statistical representation, business metrics, growth trajectory -
4910x3493px

stock market arrows, dynamic financial charts, sketch market trends, growth decline indicators, economic visualization, investment analysis tools, market performance graphics, png -
6201x5020px

Businessperson Chart, financial data graphs, man with laptop graphic, creative line chart, business success illustration, economic growth visualization, professional data analysis -
512x512px

economic development chart, business growth diagram, development economics line graph, economic progress bar chart, financial progress visualization, market expansion analysis, sustainable growth trends -
512x512px

line chart economy, finance diagram icon, business arrow symbol, yellow circle graph, economic trend analysis, financial growth visualization, data representation chart -
564x536px

rising financial chart, red profit graph, business growth illustration, investment performance metrics, economic trend analysis, market success visualization, corporate earnings trajectory -
3000x2200px

red arrow growth chart, business development strategy, economic growth visualization, company sales progress, financial performance metrics, strategic planning tools, market expansion trends -
512x512px

economic growth chart, revenue bar graph, green finance icon, initial public offering symbol, business development metrics, financial progress visualization, investment growth analysis -
598x500px

3D computer statistics visualization, laptop with financial charts, business research data analysis, stock market trend graphs, financial growth metrics, data-driven decision making, technology-driven business insights -
1100x869px

business finance color analysis, financial data visualization, economic growth charts, investment analysis graphs, market research diagrams, strategic planning tools, wealth management insights -
1200x900px

dollar sign icon, revenue growth chart, business profit analysis, sales performance metrics, financial data visualization, economic trend analysis, magnifying glass finance -
980x960px

growth chart icon, analytics symbol, economic development diagram, finance statistics, business progress visualization, data trend analysis, investment performance graph -
954x550px

big data analysis, business analytics trends, data science graphs, predictive analytics charts, market research visuals, financial reporting diagrams, corporate performance metrics -
599x600px

economic growth chart, GDP trend analysis, price level graph, economic development diagram, financial performance visualization, economic progress indicator, macroeconomic data representation -
614x561px

pie chart visualization, bar graph analysis, data presentation graphics, statistics research tools, financial growth charts, business analytics, infographic design elements -
800x505px

foreign exchange market profit trends, stock trading strategies analysis, registered investment adviser financial growth, binary option price increase, investment graph performance, market trend forecast charts, finance strategy visual data -
978x595px

Wall Street bull market, electric blue financial charts, stock exchange investment trends, seasonal market adjustments, economic growth indicators, financial data visualization, market analysis tools -
980x700px

purple growth arrow, business bar chart, presentation transparency, information diagram, financial progress, market analysis, data visualization -
1756x1762px

Arrow Market Graph, green stock market trend, upward financial chart, growth indicator, economic progress symbol, investment success graphic, positive market trajectory -
800x500px

business statistics analysis, management data visualization, business intelligence charts, organization performance metrics, financial trend analysis, market research graphs, data-driven decision making -
850x605px

binary option trading strategy, exchange market analysis, trader profit diagram, futures contract finance, investment growth chart, market trend visualization, financial performance metrics -
512x512px

black bar chart, economic growth graph, financial economics icon, monochrome business symbol, data visualization, statistical analysis, economic trends -
632x513px

business chart company, information technology services, data analysis graph, chamber of commerce trends, financial growth visualization, corporate performance metrics, industry progress indicators -
665x544px

conversion rate optimization graph, pay-per-click sales growth, SEO bar chart with rocket, marketing performance metrics, digital advertising success, business growth visualization, analytics trend analysis -
768x600px

Economy of Ukraine growth, Ukrainian financial development, investment opportunities in Ukraine, Ukrainian economic trends, financial progress visualization, wealth accumulation graph, economic prosperity indicators -
2400x1800px

Business analytics dashboard, data visualization charts, performance management graphs, big data analysis, digital marketing insights, financial reporting tools, strategic business intelligence -
5461x2428px

forex trading chart, candlestick chart design, fluctuating market trends, trading backdrop, financial market analysis, stock market visualization, investment graph, png -
2500x1875px

growth increase illustration, 3D arrows, business information service, histogram side view, financial growth chart, economic progress visualization, data analysis graph -
740x400px

finance investment growth, stock market analysis, financial market trends, money profit diagram, economic data visualization, investment strategy chart, capital market insights -
900x900px

digital marketing strategies, growth hacking techniques, target market analysis, SEO content marketing, online business analytics, marketing plan development, technology-driven marketing -
693x647px

content marketing strategy, business growth diagram, blue arrow graph, sales development trend, strategic planning chart, organizational progress visualization, technology advancement trajectory -
500x500px

binary option trading chart, day trading financial analysis, investment market trends, stock trade visualization, candlestick chart analysis, financial market patterns, trading strategy insights -
2200x1700px

Profit margin chart, financial growth diagram, business revenue analysis, gross margin visualization, economic performance metrics, corporate earnings trends, strategic financial planning -
1349x1110px

red decline arrow, financial trend analysis, business graph illustration, economic crisis symbol, market downturn visualization, negative growth chart, recession impact diagram -
1280x853px

economic recession graph, stock market crash diagram, financial volatility chart, economic downturn visualization, financial crisis trends, investment risk analysis, market performance decline, png -
980x832px

profit chart icon, business finance symbol, income growth graph, nonprofit organization logo, financial success indicator, monetary progress chart, economic development graphic -
512x512px

bar chart statistics, statistical graph icons, business data visualization, chart arrow growth, fiscal trend analysis, financial progress illustration, data representation trends -
1100x825px

predictive analytics on smartphone, business intelligence dashboard, prescriptive analytics charts, data analysis infographics, mobile business stats visualization, financial performance metrics, digital information technology insights -
1900x1900px

Microsoft PowerPoint economy template, marketing financial analysis, service revenue growth, yellow arrow chart, business budget planning, economic data visualization, financial performance metrics -
600x429px

red arrow sales growth, digital marketing strategies, sales force management, revenue increase diagram, business performance metrics, marketing analytics chart, sales optimization techniques -
935x884px

business template infographic, color chart diagram, digital classification chart, multi-colored cellular chart, hexagonal data visualization, infographic design elements, technology icon layout -
512x512px

financial accounting charts, desktop office supplies, pie chart analysis, stock market statistics, business data visualization, electronic financial tools, accounting technology trends -
1680x1688px

profit growth curve, green arrow diagram, business revenue increase, net income chart, financial success trend, upward trajectory graph, economic progress symbol -
500x500px

market analysis diagram, business analytics logo, marketing strategy tags, market research service, data visualization tools, competitive analysis chart, industry trend analysis -
950x473px

Options strategies diagram, forex market analysis, stock trading chart, thinkorswim investment tools, candlestick pattern recognition, financial market trends, leverage trading strategies -
512x512px

financial statement chart, finance report icon, business presentation board, money organization graph, data visualization tools, economic growth analysis, corporate financial planning -
499x840px

infographic chart template, fashion business infographic, digital label design, summary graph data, visual data presentation, infographic design elements, business infographic layout
