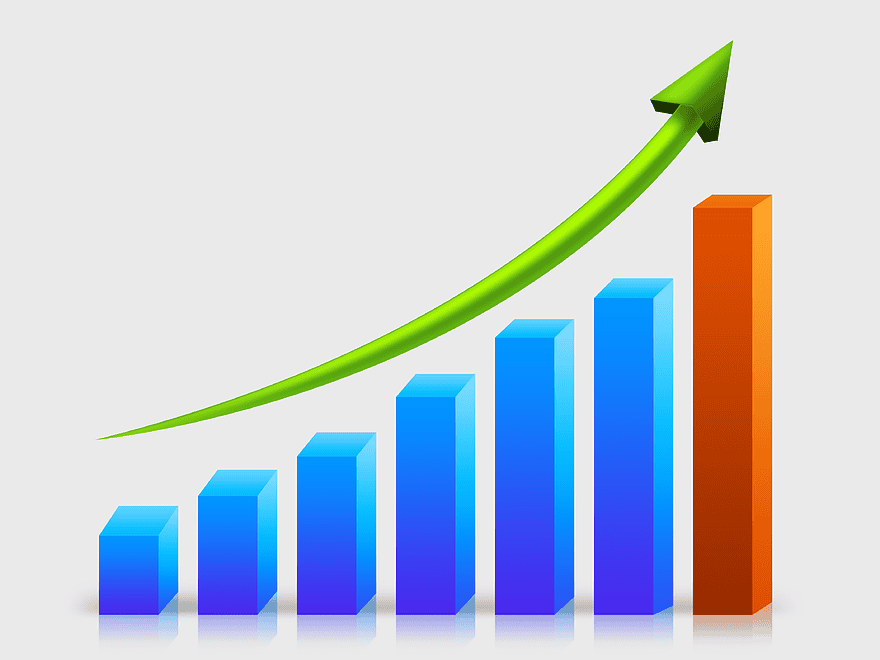
Graph of a function, market growth chart, bar chart visualization, stock market statistics, data representation diagram, financial trend analysis, business performance metrics, PNG free download
Graph of a function, market growth chart, bar chart visualization, stock market statistics, data representation diagram, financial trend analysis, business performance metrics
More related PNGs
1318x1439pxInfographic chart icon, creative PPT element, assorted-color line illustration, information label, visual data representation, presentation graphics, design template, analytical diagram
1084x620pxgeometric options chart, layered infographic design, bright color sequence, triangle number layout, visual data representation, structured information graphic, modern product diagram, digital presentation elements
962x1439pxbusiness infographic design, option text overlays, data visualization elements, presentation icons, infographic templates, visual content marketing, business analysis tools, marketing presentation materials
752x1000pxpencil infographic chart, assorted-color pencils presentation, step-by-step business process, classification chart with icons, educational infographic design, visual data representation, step guide illustration
1156x2020pxlight bulb marketing strategy, big data business icons, digital marketing communication diagram, social media marketing technology, innovation network concept, strategic planning visuals, data-driven business solutions
1200x1200pxdigital marketing analytics, SEO strategy diagram, content marketing analysis, social media marketing insights, online business growth, data-driven marketing solutions, web performance optimization
1436x1111pxbar graph illustration, growth chart template, function diagram chart, yellow bar chart, data visualization design, business growth analysis, upward trend arrow
1000x710pxCandlestick chart pattern, Technical analysis for traders, Red and green stock bars, Open-high-low-close chart, Financial market analysis, Trading chart visualization, Stock market trend analysis
586x586pxmoney illustration, cash payment diagram, united states dollar bills, gold bars with cash, financial assets visual, wealth representation art, currency stack graphic
512x512pxline chart data visualization, bar chart market analysis, graph trend analysis, timeline data plot, statistical infographic design, business performance metrics, financial growth chart
510x511pxinformation infographic design, colorful circle chart, business data visualization, presentation slide elements, infographic template layout, circular diagram graphics, statistical data representation
935x884pxbusiness template infographic, color chart diagram, digital classification chart, multi-colored cellular chart, hexagonal data visualization, infographic design elements, technology icon layout
609x488pxdata analytics visualization, business process management, market research analysis, data processing tools, financial report analysis, strategic planning tools, information management systems
500x571pxbusiness growth bar chart, blue angle graph illustration, economic growth chart design, company progress visualization, financial trend analysis, data representation infographic, performance metrics diagram
512x512pxbar chart icon, statistical diagram, business data visualization, chart analysis, financial growth graph, infographic elements, data representation tools
2151x3071pxPPT design elements, infographic chart labels, business material tags, sequence information bars, decorative UI components, presentation layout templates, visual data classification tools
1100x981pxpredictive analytics on tablet, business intelligence infographics, smartphone data analysis, digital electronic products, mobile business stats, tech-driven financial insights, modern data visualization tools
980x736pxbar chart icon, black and white graph, economic growth symbol, monochrome technology logo, data visualization graphic, business trend analysis, financial progress indicator
2250x2100pxmagnifying glass analytics, market research data, predictive analytics insights, qualitative research analysis, data visualization tools, business intelligence graphs, strategic planning charts
1024x768pxbar chart growth, graph of a function, online advertising design, diagram chart brand, data visualization trends, business analytics metrics, performance tracking tools
6201x5020pxBusinessperson Chart, financial data graphs, man with laptop graphic, creative line chart, business success illustration, economic growth visualization, professional data analysis
614x561pxpie chart visualization, bar graph analysis, data presentation graphics, statistics research tools, financial growth charts, business analytics, infographic design elements
512x512pxgreen arrow graph, bar chart growth, analytics statistics, report diagram, data visualization, business trends, performance metrics
800x556pxquantitative research methods, market analysis tools, data collection techniques, business research diagrams, statistical analysis visuals, research methodology graphics, competitive market insights
512x512pxline chart, multicolored graph, data visualization, trend analysis, statistical representation, business metrics, growth trajectory
499x840pxinfographic chart template, fashion business infographic, digital label design, summary graph data, visual data presentation, infographic design elements, business infographic layout
500x573pxdata quality analysis, pattaya data analytics, data cleansing icons, communication diagram, data visualization tools, statistical analysis methods, business intelligence insights
2400x1800pxBusiness analytics dashboard, data visualization charts, performance management graphs, big data analysis, digital marketing insights, financial reporting tools, strategic business intelligence
5353x2966pxstock market arrows, flat design line chart, sketch market trends, financial growth indicators, economic data visualization, investment analysis tools, business performance metrics, png
500x500pxmarket analysis diagram, business analytics logo, marketing strategy tags, market research service, data visualization tools, competitive analysis chart, industry trend analysis
933x979px3D business chart, rising arrow graph, business analysis visualization, green bar chart, financial growth indicator, corporate success metrics, data trend analysis
1006x1003pxfinancial statement analysis, small business accounting tools, tax management services, office equipment for finance, financial data visualization, business growth metrics, accountant workspace setup
512x512pxfinancial accounting charts, desktop office supplies, pie chart analysis, stock market statistics, business data visualization, electronic financial tools, accounting technology trends
1039x768pxinfo angle design, elements PPT chart, yellow teal bar illustration, presentation design elements, infographic template, visual data representation, modern slide graphics
1920x1357pxblue arrow up graph, economic growth analysis, finance performance indicator, sustainable development chart, upward trend visualization, financial progress metrics, economic development indicators
600x508pxDigital marketing growth chart, SEO performance graph, NIFTY 50 business trends, stock market increase diagram, financial progress visualization, economic development metrics, market analysis infographic
982x1000pxgrowth chart, economic development, bar chart, business development, financial progress, data visualization, upward trend
980x700pxpurple growth arrow, business bar chart, presentation transparency, information diagram, financial progress, market analysis, data visualization
512x512pxline chart economy, finance diagram icon, business arrow symbol, yellow circle graph, economic trend analysis, financial growth visualization, data representation chart
1000x704pxgreen bar chart illustration, economic growth statistics, business performance metrics, rising arrow graphic, financial progress visualization, market trend analysis, data representation chart
1100x869pxbusiness finance color analysis, financial data visualization, economic growth charts, investment analysis graphs, market research diagrams, strategic planning tools, wealth management insights
598x500px3D computer statistics visualization, laptop with financial charts, business research data analysis, stock market trend graphs, financial growth metrics, data-driven decision making, technology-driven business insights
4119x2412pxblue line trend chart, financial data analysis, stock market trend graph, blue abstract line plot, economic growth visualization, business performance metrics, technology trend analysis
1100x825pxpredictive analytics on smartphone, business intelligence dashboard, prescriptive analytics charts, data analysis infographics, mobile business stats visualization, financial performance metrics, digital information technology insights
978x595pxWall Street bull market, electric blue financial charts, stock exchange investment trends, seasonal market adjustments, economic growth indicators, financial data visualization, market analysis tools
768x425pxPredictive analytics tools, Big data visualization, Data analysis techniques, Prescriptive analytics strategies, Business intelligence dashboard, Information technology solutions, Marketing analytics insights
4050x4050pxEuclidean geometry formulas, math shapes and equations, triangle and circle diagrams, graph of a function plots, geometric shapes analysis, mathematical concept illustrations, educational math visuals
800x500pxbusiness statistics analysis, management data visualization, business intelligence charts, organization performance metrics, financial trend analysis, market research graphs, data-driven decision making
512x512pxbar chart statistics, statistical graph icons, business data visualization, chart arrow growth, fiscal trend analysis, financial progress illustration, data representation trends
1024x1024pxFatality Analysis Reporting System icons, computer report symbols, black and white business charts, diagram analysis logo, data visualization graphics, statistical report, infographic elements design
1051x875pxaccounting business financial statement, calculator with graphs illustration, office supplies for accountants, cost accounting analysis, financial data visualization, business management tools, audit and financial reporting
807x400pxNetwork effect visualization, computer network diagram, internet connectivity graph, network layer analysis, digital network structure, online organization chart, data flow network
820x618pxdata mining visualization, big data network analysis, information technology graph, machine learning clusters, predictive analytics diagram, data analysis connections, bioinformatics network
512x512pxstatistics chart icon, monochrome business symbol, analytics diagram, black and white info graphic, data visualization, trend analysis, growth indicator
512x512pxblack bar chart, economic growth graph, financial economics icon, monochrome business symbol, data visualization, statistical analysis, economic trends
954x550pxbig data analysis, business analytics trends, data science graphs, predictive analytics charts, market research visuals, financial reporting diagrams, corporate performance metrics
1524x950pxsound wave visualization, audio spectrum analysis, equalizer bar graph, acoustic frequency chart, music frequency display, audio waveform representation, sound recording equalization
1100x1004pxblue and white globe, BOCOM International Investment, infographics and charts, smartphone technology, global financial data, digital investment analysis, modern business statistics