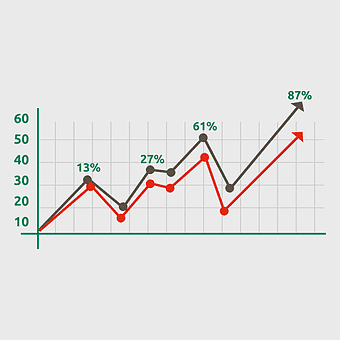
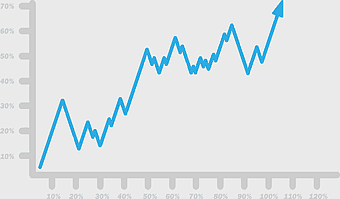
Economic growth chart, revenue bar graph, green finance icon, initial public offering symbol, business development metrics, financial progress visualization, investment growth analysis, PNG

keywords
- economic growth chart
- revenue bar graph
- green finance icon
- initial public offering symbol
- business development metrics
- financial progress visualization
- investment growth analysis
License: Personal use only
More related PNGs
-
500x571px

business growth bar chart, blue angle graph illustration, economic growth chart design, company progress visualization, financial trend analysis, data representation infographic, performance metrics diagram -
980x736px

bar chart icon, black and white graph, economic growth symbol, monochrome technology logo, data visualization graphic, business trend analysis, financial progress indicator -
1920x1357px

blue arrow up graph, economic growth analysis, finance performance indicator, sustainable development chart, upward trend visualization, financial progress metrics, economic development indicators -
982x1000px

growth chart, economic development, bar chart, business development, financial progress, data visualization, upward trend -
512x512px

line chart data visualization, bar chart market analysis, graph trend analysis, timeline data plot, statistical infographic design, business performance metrics, financial growth chart -
933x979px

3D business chart, rising arrow graph, business analysis visualization, green bar chart, financial growth indicator, corporate success metrics, data trend analysis -
1592x1194px

business growth chart, conversion rate optimization, digital marketing graph, interest rate trends, financial progress visualization, economic development metrics, performance analysis chart -
1200x1200px

Sales growth chart, business profit symbol, marketing revenue icons, purchasing analytics graph, financial success indicators, corporate earnings visualization, economic performance metrics -
1200x900px

dollar sign icon, revenue growth chart, business profit analysis, sales performance metrics, financial data visualization, economic trend analysis, magnifying glass finance -
1324x900px

Business loan growth, money stack investment, financial services chart, unsecured debt management, wealth accumulation strategy, economic progress visualization, capital expansion trends -
980x832px

profit chart icon, business finance symbol, income growth graph, nonprofit organization logo, financial success indicator, monetary progress chart, economic development graphic -
1024x855px

cash flow analysis, business investment chart, financial management diagram, accounting data visualization, economic growth trends, strategic planning tools, investment portfolio analysis -
600x508px

Digital marketing growth chart, SEO performance graph, NIFTY 50 business trends, stock market increase diagram, financial progress visualization, economic development metrics, market analysis infographic -
1436x1111px

bar graph illustration, growth chart template, function diagram chart, yellow bar chart, data visualization design, business growth analysis, upward trend arrow -
1100x869px

business finance color analysis, financial data visualization, economic growth charts, investment analysis graphs, market research diagrams, strategic planning tools, wealth management insights -
512x512px

bar chart icon, statistical diagram, business data visualization, chart analysis, financial growth graph, infographic elements, data representation tools -
1000x704px

green bar chart illustration, economic growth statistics, business performance metrics, rising arrow graphic, financial progress visualization, market trend analysis, data representation chart -
6201x5020px

Businessperson Chart, financial data graphs, man with laptop graphic, creative line chart, business success illustration, economic growth visualization, professional data analysis -
512x512px

black bar chart, economic growth graph, financial economics icon, monochrome business symbol, data visualization, statistical analysis, economic trends -
512x512px

line chart economy, finance diagram icon, business arrow symbol, yellow circle graph, economic trend analysis, financial growth visualization, data representation chart -
980x960px

growth chart icon, analytics symbol, economic development diagram, finance statistics, business progress visualization, data trend analysis, investment performance graph -
512x512px

financial statement chart, finance report icon, business presentation board, money organization graph, data visualization tools, economic growth analysis, corporate financial planning -
614x561px

pie chart visualization, bar graph analysis, data presentation graphics, statistics research tools, financial growth charts, business analytics, infographic design elements -
5353x2966px

stock market arrows, flat design line chart, sketch market trends, financial growth indicators, economic data visualization, investment analysis tools, business performance metrics, png -
512x512px

green arrow graph, bar chart growth, analytics statistics, report diagram, data visualization, business trends, performance metrics -
768x600px

Economy of Ukraine growth, Ukrainian financial development, investment opportunities in Ukraine, Ukrainian economic trends, financial progress visualization, wealth accumulation graph, economic prosperity indicators -
980x980px

stock market chart, financial market analysis, investment growth symbol, bar chart visualization, economic trend indicator, asset valuation graph, monetary performance metric -
512x512px

economic development chart, business growth diagram, development economics line graph, economic progress bar chart, financial progress visualization, market expansion analysis, sustainable growth trends -
512x512px

line chart, multicolored graph, data visualization, trend analysis, statistical representation, business metrics, growth trajectory -
980x700px

purple growth arrow, business bar chart, presentation transparency, information diagram, financial progress, market analysis, data visualization -
512x512px

bar chart statistics, statistical graph icons, business data visualization, chart arrow growth, fiscal trend analysis, financial progress illustration, data representation trends -
1024x768px

bar chart growth, graph of a function, online advertising design, diagram chart brand, data visualization trends, business analytics metrics, performance tracking tools -
1006x1003px

financial statement analysis, small business accounting tools, tax management services, office equipment for finance, financial data visualization, business growth metrics, accountant workspace setup -
564x536px

rising financial chart, red profit graph, business growth illustration, investment performance metrics, economic trend analysis, market success visualization, corporate earnings trajectory -
1900x1900px

Microsoft PowerPoint economy template, marketing financial analysis, service revenue growth, yellow arrow chart, business budget planning, economic data visualization, financial performance metrics -
621x427px

return on investment, investment company, rate of return, return on equity, financial growth chart, business performance metrics, investment analysis tools -
1280x853px

Growth Chart, Progress Analysis, Achievement Graph, Increase Diagram, Business Metrics, Data Trending, Success Visualization, png -
1987x2115px

line graph finance, blue market analysis chart, stock market trend, financial information diagram, economic growth visualization, investment performance metrics, market data analytics -
4119x2412px

blue line trend chart, financial data analysis, stock market trend graph, blue abstract line plot, economic growth visualization, business performance metrics, technology trend analysis -
680x578px

3D bar graph finance, service trade chart, cargo business analysis, material price rise, financial growth visualization, economic data representation, market trend illustration -
1600x946px

economic growth trends, green economic indicators, global finance symbols, sustainable development economics, world economy visualization, financial health metrics, eco-friendly business strategies -
778x647px

red zig zag arrow, market growth chart, stock market analysis, website branding, financial trend indicator, business performance graph, upward trajectory symbol -
1440x936px

financial growth chart, business revenue planning, investment management diagram, profit analysis checklist, financial strategy visualization, economic planning illustration, business analytics graphic -
1756x1762px

Arrow Market Graph, green stock market trend, upward financial chart, growth indicator, economic progress symbol, investment success graphic, positive market trajectory -
2200x1700px

Profit margin chart, financial growth diagram, business revenue analysis, gross margin visualization, economic performance metrics, corporate earnings trends, strategic financial planning -
2433x1521px

business plan visual representation, performance metrics chart analysis, marketing strategy infographic, economic growth graph, project management pie chart, data visualization insights, business analytics overview -
700x582px

financial report analysis, investment calculator tools, bank finance charts, office equipment for finance, financial data visualization, business analytics tools, money management graphs -
3000x2200px

red arrow growth chart, business development strategy, economic growth visualization, company sales progress, financial performance metrics, strategic planning tools, market expansion trends -
980x902px

financial planning graph, business trend analysis, investment growth chart, monochrome financial logo, economic performance chart, budgetary data visualization, wealth management icons -
1024x768px

revenue management icons, yield management sales, money increase graph, business profit analysis, financial growth chart, economic performance metrics, strategic pricing tools -
1024x1024px

investment growth chart, dollar sign with upward arrow, business profit symbol, trendy finance illustration, financial success icon, economic trend visualization, wealth accumulation graphic -
1000x710px

Candlestick chart pattern, Technical analysis for traders, Red and green stock bars, Open-high-low-close chart, Financial market analysis, Trading chart visualization, Stock market trend analysis -
512x512px

Bar chart with arrow, growth trend graph, progress diagram icon, bluegreen bar chart, statistical analysis, data visualization, business metrics -
850x605px

binary option trading strategy, exchange market analysis, trader profit diagram, futures contract finance, investment growth chart, market trend visualization, financial performance metrics -
916x811px

economic growth illustration, GDP visualization, wealth accumulation, finance trends, investment returns, monetary progress, economic prosperity -
3333x2500px

Graph of a function, market growth chart, bar chart visualization, stock market statistics, data representation diagram, financial trend analysis, business performance metrics -
2500x1875px

growth increase illustration, 3D arrows, business information service, histogram side view, financial growth chart, economic progress visualization, data analysis graph -
900x743px

credit score improvement, FICO score diagram, personal finance growth, blue bar graph, financial progress chart, creditworthiness visualization, economic trend analysis -
1680x1688px

profit growth curve, green arrow diagram, business revenue increase, net income chart, financial success trend, upward trajectory graph, economic progress symbol -
632x513px

business chart company, information technology services, data analysis graph, chamber of commerce trends, financial growth visualization, corporate performance metrics, industry progress indicators -
1600x1080px

business economics, green finance, sustainable organization, economic growth, global currency symbols, financial market trends, eco-friendly business practices -
599x600px

economic growth chart, GDP trend analysis, price level graph, economic development diagram, financial performance visualization, economic progress indicator, macroeconomic data representation -
600x564px

Bar chart diagram, line graph visualization, gnuplot data representation, progress chart icon, statistical chart analysis, data visualization infographic, business organization graph -
740x400px

finance investment growth, stock market analysis, financial market trends, money profit diagram, economic data visualization, investment strategy chart, capital market insights -
658x2171px

gold coin stacks, dollar symbol currency, finance money icons, golden wealth symbols, coin collection art, financial growth, investment assets visuals -
1000x607px

desk calculator, financial statement analysis, investment calculation tools, 3D graph illustration, business data visualization, office equipment for finance, financial planning charts -
598x500px

3D computer statistics visualization, laptop with financial charts, business research data analysis, stock market trend graphs, financial growth metrics, data-driven decision making, technology-driven business insights -
512x512px

profit business icons, finance investment symbols, money management charts, black and white dollar signs, economic growth visuals, financial success graphics, wealth accumulation -
2251x1352px

saving trends, investment growth, gold coin stacks, economic development, financial progress visualization, wealth accumulation process, market prosperity indicators -
512x512px

earnings growth diagram, finance profit visual, revenue symbol chart, investment gain chart, money flow analysis, economic profit indication, capital market symbol -
900x900px

assorted-color bar graph illustration, economic growth free content, business growth chart diagram, chart of a function, financial data visualization, progress indicator chart, multicolor bar chart trends -
512x512px

finance control chart, business bar chart, hand holding graph, yellow finance diagram, financial growth visualization, corporate performance metrics, strategic planning tools -
1024x1024px

financial bar graph report, credit history balance sheet, organization statistics chart, personal finance investment analysis, data visualization infographics, business financial reporting, annual financial performance review -
1100x626px

financial analysis report, business trend graph, calculator with financial data, pie chart and bar graph, economic analysis tools, financial statement review, office equipment for finance -
978x595px

Wall Street bull market, electric blue financial charts, stock exchange investment trends, seasonal market adjustments, economic growth indicators, financial data visualization, market analysis tools
