economic performance chart PNG, stickers, cliparts, transparent illustration & graphics
500x571px
business growth bar chart, blue angle graph illustration, economic growth chart design, company progress visualization, financial trend analysis, data representation infographic, performance metrics diagram
1920x1357px
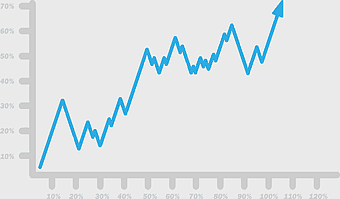
blue arrow up graph, economic growth analysis, finance performance indicator, sustainable development chart, upward trend visualization, financial progress metrics, economic development indicators
1592x1194px
business growth chart, conversion rate optimization, digital marketing graph, interest rate trends, financial progress visualization, economic development metrics, performance analysis chart
5353x2966px
stock market arrows, flat design line chart, sketch market trends, financial growth indicators, economic data visualization, investment analysis tools, business performance metrics, png
1200x1200px
Sales growth chart, business profit symbol, marketing revenue icons, purchasing analytics graph, financial success indicators, corporate earnings visualization, economic performance metrics
1000x704px
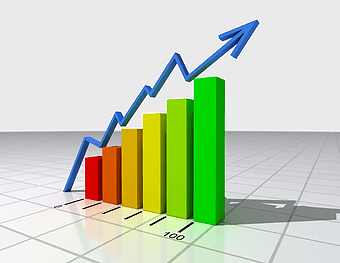
green bar chart illustration, economic growth statistics, business performance metrics, rising arrow graphic, financial progress visualization, market trend analysis, data representation chart
4910x3493px
stock market arrows, dynamic financial charts, sketch market trends, growth decline indicators, economic visualization, investment analysis tools, market performance graphics, png
2433x1521px
business plan visual representation, performance metrics chart analysis, marketing strategy infographic, economic growth graph, project management pie chart, data visualization insights, business analytics overview
1200x900px
dollar sign icon, revenue growth chart, business profit analysis, sales performance metrics, financial data visualization, economic trend analysis, magnifying glass finance
599x600px
economic growth chart, GDP trend analysis, price level graph, economic development diagram, financial performance visualization, economic progress indicator, macroeconomic data representation
600x508px
Digital marketing growth chart, SEO performance graph, NIFTY 50 business trends, stock market increase diagram, financial progress visualization, economic development metrics, market analysis infographic
980x980px
stock market chart, financial market analysis, investment growth symbol, bar chart visualization, economic trend indicator, asset valuation graph, monetary performance metric
4119x2412px
blue line trend chart, financial data analysis, stock market trend graph, blue abstract line plot, economic growth visualization, business performance metrics, technology trend analysis
980x902px
financial planning graph, business trend analysis, investment growth chart, monochrome financial logo, economic performance chart, budgetary data visualization, wealth management icons
1900x1900px
Microsoft PowerPoint economy template, marketing financial analysis, service revenue growth, yellow arrow chart, business budget planning, economic data visualization, financial performance metrics
1280x853px
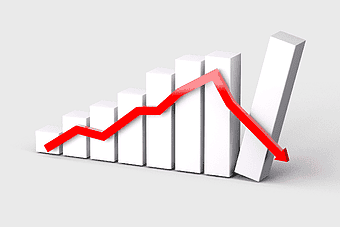
economic recession graph, stock market crash diagram, financial volatility chart, economic downturn visualization, financial crisis trends, investment risk analysis, market performance decline, png
564x536px
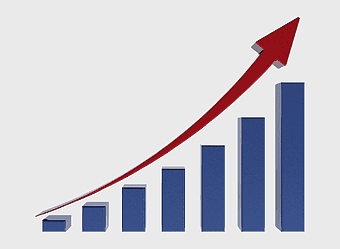
rising financial chart, red profit graph, business growth illustration, investment performance metrics, economic trend analysis, market success visualization, corporate earnings trajectory
980x960px
growth chart icon, analytics symbol, economic development diagram, finance statistics, business progress visualization, data trend analysis, investment performance graph
3000x2200px
red arrow growth chart, business development strategy, economic growth visualization, company sales progress, financial performance metrics, strategic planning tools, market expansion trends
512x512px
dollar sign chart, sales diagram icon, market bar chart, stock market symbol, financial growth illustration, economic trend analysis, investment performance graphic
2200x1700px
Profit margin chart, financial growth diagram, business revenue analysis, gross margin visualization, economic performance metrics, corporate earnings trends, strategic financial planning
1987x2115px
line graph finance, blue market analysis chart, stock market trend, financial information diagram, economic growth visualization, investment performance metrics, market data analytics
1024x768px
revenue management icons, yield management sales, money increase graph, business profit analysis, financial growth chart, economic performance metrics, strategic pricing tools
1280x960px
Data visualization, financial growth chart, investment graph, profit increase, economic trends, market analysis, business performance metrics, png
1920x909px
market index trends, stock market performance, investment growth analysis, market capitalization graph, financial chart visualization, economic data representation, trading indicator analysis
512x512px
profit margin chart, business income performance, monochrome finance icons, gross profit graph, economic growth trends, financial success metrics, investment return analysis
512x512px
dollar sign illustration, digital marketing strategy, financial growth chart, pay-per-click advertising, revenue increase graph, business development trends, economic performance metrics
1920x1062px
blue financial growth chart, personal finance market analysis, stock market trend diagram, market growth visualization, economic progress graph, financial data representation, investment performance metrics


