investment graph PNG, stickers, cliparts, transparent illustration & graphics
5461x2428px
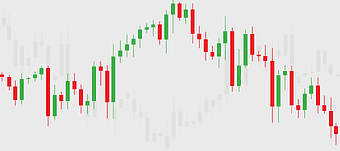
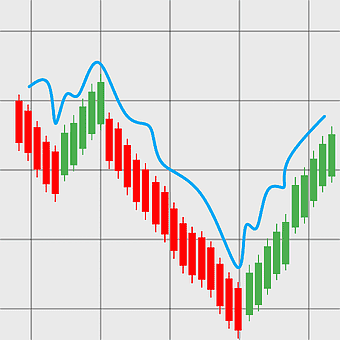
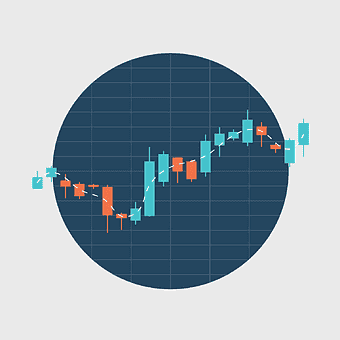
forex trading chart, candlestick chart design, fluctuating market trends, trading backdrop, financial market analysis, stock market visualization, investment graph, png
1100x869px
business finance color analysis, financial data visualization, economic growth charts, investment analysis graphs, market research diagrams, strategic planning tools, wealth management insights
768x600px
Economy of Ukraine growth, Ukrainian financial development, investment opportunities in Ukraine, Ukrainian economic trends, financial progress visualization, wealth accumulation graph, economic prosperity indicators
1024x1024px
investment finance graph, high-yield investment program, seed money growth, financial adviser analysis, investment strategy visualization, money management tools, portfolio performance tracking
800x505px
foreign exchange market profit trends, stock trading strategies analysis, registered investment adviser financial growth, binary option price increase, investment graph performance, market trend forecast charts, finance strategy visual data
700x582px
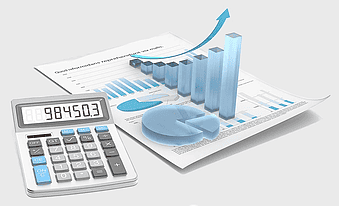
financial report analysis, investment calculator tools, bank finance charts, office equipment for finance, financial data visualization, business analytics tools, money management graphs
1756x1762px
Arrow Market Graph, green stock market trend, upward financial chart, growth indicator, economic progress symbol, investment success graphic, positive market trajectory
1000x607px
desk calculator, financial statement analysis, investment calculation tools, 3D graph illustration, business data visualization, office equipment for finance, financial planning charts
1280x1280px
Forex trading chart, stock market analysis, candlestick pattern, financial exchange, market trend visualization, investment strategy, economic data graph, png
512x512px
economic growth chart, revenue bar graph, green finance icon, initial public offering symbol, business development metrics, financial progress visualization, investment growth analysis
1280x853px
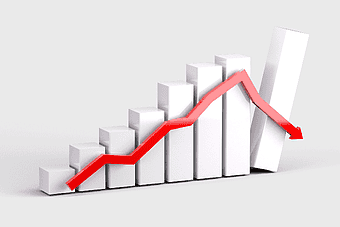
Recession graph, market crash diagram, economic downturn visualization, volatile financial trends, financial crisis analysis, investment risk depiction, economic instability illustration, png
564x536px
rising financial chart, red profit graph, business growth illustration, investment performance metrics, economic trend analysis, market success visualization, corporate earnings trajectory
501x501px
foreign exchange market trends, day trading performance graph, commodity trading advisor logo, automated trading system icon, financial market growth chart, trading analytics symbol, investment strategy icon
980x960px
growth chart icon, analytics symbol, economic development diagram, finance statistics, business progress visualization, data trend analysis, investment performance graph
1181x1181px
Day trading chart, market sentiment analysis, forex trading strategies, stock market volume, financial data visualization, investment trends graph, trading platform interface
980x980px
stock market chart, financial market analysis, investment growth symbol, bar chart visualization, economic trend indicator, asset valuation graph, monetary performance metric
1987x2115px
line graph finance, blue market analysis chart, stock market trend, financial information diagram, economic growth visualization, investment performance metrics, market data analytics
980x902px
financial planning graph, business trend analysis, investment growth chart, monochrome financial logo, economic performance chart, budgetary data visualization, wealth management icons
1024x1024px
financial bar graph report, credit history balance sheet, organization statistics chart, personal finance investment analysis, data visualization infographics, business financial reporting, annual financial performance review
876x548px
data-driven business analytics, real estate investment statistics, digital marketing growth charts, plastic toy blocks for business concepts, financial data visualization tools, strategic management graphs, economic trend analysis techniques
1280x853px
economic recession graph, stock market crash diagram, financial volatility chart, economic downturn visualization, financial crisis trends, investment risk analysis, market performance decline, png
1280x960px
Data visualization, financial growth chart, investment graph, profit increase, economic trends, market analysis, business performance metrics, png
512x512px
reduction bar chart, investment decrease, red arrow icon, economy line graph, financial trend analysis, business performance metrics, stock market visualization
1920x909px
market index trends, stock market performance, investment growth analysis, market capitalization graph, financial chart visualization, economic data representation, trading indicator analysis
512x512px
profit margin chart, business income performance, monochrome finance icons, gross profit graph, economic growth trends, financial success metrics, investment return analysis
1920x1062px
blue financial growth chart, personal finance market analysis, stock market trend diagram, market growth visualization, economic progress graph, financial data representation, investment performance metrics


