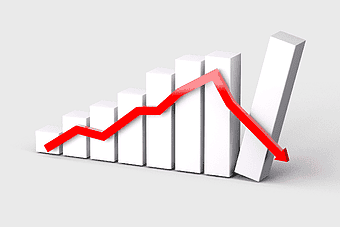
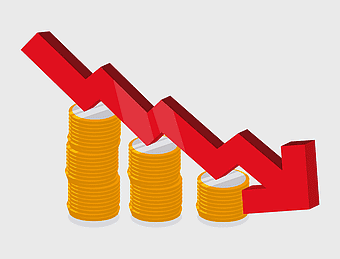
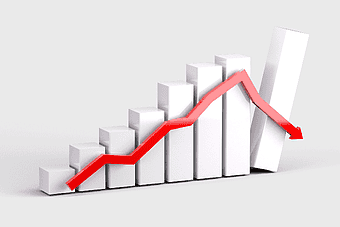
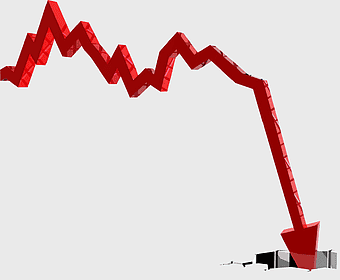
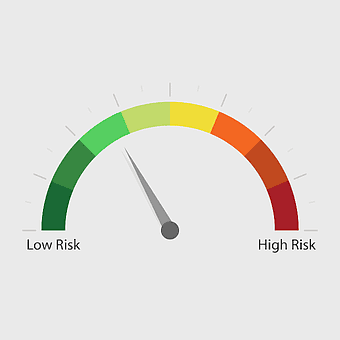
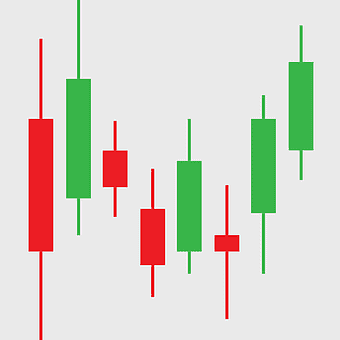
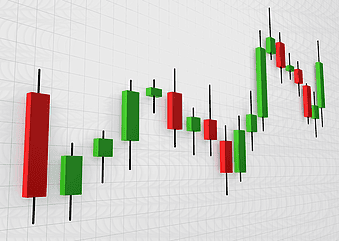
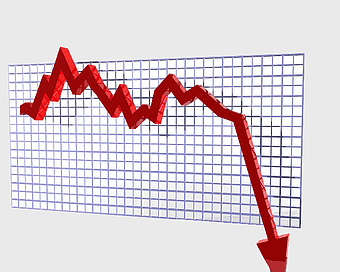
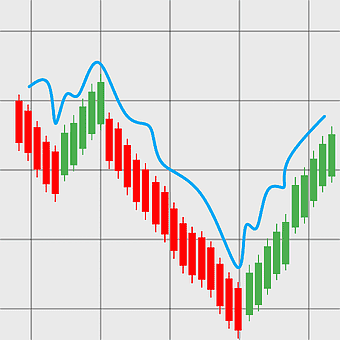
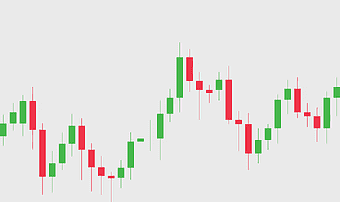
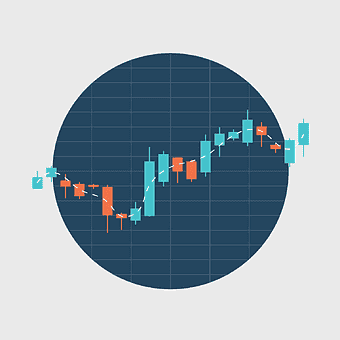
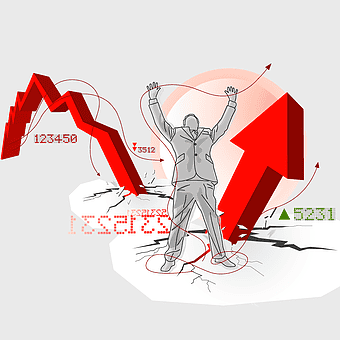
Hang Seng Index decline, red arrows stock market crash, market capitalization drop, SSE Composite Index fall, financial market downturn, economic indicator fall, investment risk visualization, PNG

keywords
- Hang Seng Index decline
- red arrows stock market crash
- market capitalization drop
- SSE Composite Index fall
- financial market downturn
- economic indicator fall
- investment risk visualization
License: Personal use only
More related PNGs
-
1280x853px

economic recession graph, stock market crash diagram, financial volatility chart, economic downturn visualization, financial crisis trends, investment risk analysis, market performance decline, png -
4910x3493px

stock market arrows, dynamic financial charts, sketch market trends, growth decline indicators, economic visualization, investment analysis tools, market performance graphics, png -
1000x762px

financial crisis 2007-2008, red down arrow, stock market decline, business downturn, economic recession graphic, financial decline illustration, monetary crisis diagram -
1280x853px

Recession graph, market crash diagram, economic downturn visualization, volatile financial trends, financial crisis analysis, investment risk depiction, economic instability illustration, png -
5353x2966px

stock market arrows, flat design line chart, sketch market trends, financial growth indicators, economic data visualization, investment analysis tools, business performance metrics, png -
1280x1280px

Bear Market, Stock Market Decline, Red Bear Icon, Share Price Drop, Financial Downturn, Economic Recession, Investment Losses, png -
978x595px

Wall Street bull market, electric blue financial charts, stock exchange investment trends, seasonal market adjustments, economic growth indicators, financial data visualization, market analysis tools -
778x647px

red zig zag arrow, market growth chart, stock market analysis, website branding, financial trend indicator, business performance graph, upward trajectory symbol -
1349x1110px

red decline arrow, financial trend analysis, business graph illustration, economic crisis symbol, market downturn visualization, negative growth chart, recession impact diagram -
740x400px

finance investment growth, stock market analysis, financial market trends, money profit diagram, economic data visualization, investment strategy chart, capital market insights -
1324x900px

Business loan growth, money stack investment, financial services chart, unsecured debt management, wealth accumulation strategy, economic progress visualization, capital expansion trends -
1756x1762px

Arrow Market Graph, green stock market trend, upward financial chart, growth indicator, economic progress symbol, investment success graphic, positive market trajectory -
1600x1100px

Recession Economy, Payment Money Market, Market risk, Investment Wealth, Financial Crisis, Economic Downturn, Business Cycle Analysis -
1920x909px

market index trends, stock market performance, investment growth analysis, market capitalization graph, financial chart visualization, economic data representation, trading indicator analysis -
1311x1306px

money investment growth, dollar bill stacks, financial rise arrow, savings funding, wealth accumulation, economic progress, capital increase -
2500x1875px

money IPBRICK, SA investment expense, red arrow polyline, stack of banknotes, financial decline visualization, economic downturn, us dollar investment trends -
1500x1292px

money investment success, falling cash celebration, bank loan approval, formal wear businessman, financial growth strategy, wealth accumulation tips, economic prosperity visuals -
2083x2083px

risk gauge diagram, investment credit risk management, exchange-traded fund risk analysis, counterparty risk indicator, financial risk assessment tool, market risk visualization, security investment metrics -
2608x2379px

Gold coins investment, falling gold currency, financial savings art, wealth accumulation visuals, economic assets illustration, capital preservation graphics, financial prosperity -
1180x458px

Finance market bull and bear, financial adviser investment strategies, asset management trends, stock market analysis, economic indicators visualization, financial planning tools, market performance graphics -
500x500px

binary option trading chart, day trading financial analysis, investment market trends, stock trade visualization, candlestick chart analysis, financial market patterns, trading strategy insights -
1000x710px

Candlestick chart pattern, Technical analysis for traders, Red and green stock bars, Open-high-low-close chart, Financial market analysis, Trading chart visualization, Stock market trend analysis -
4181x3936px

stock market bull, bull market trend, golden bull symbol, upward market arrow, financial growth indicator, economic prosperity icon, investment optimism sign, png -
500x500px

red arrow options strategies, trader trading strategy market, red arrow finance diagram, stock market profit indicator, upward trend analysis, investment growth symbol, market performance visualization -
1920x1357px

blue arrow up graph, economic growth analysis, finance performance indicator, sustainable development chart, upward trend visualization, financial progress metrics, economic development indicators -
600x480px

Nigeria economic downturn, global recession graph, straight down arrow icon, financial crisis visualization, economic decline chart, GDP contraction diagram, world economy decline trend -
2251x1352px

saving trends, investment growth, gold coin stacks, economic development, financial progress visualization, wealth accumulation process, market prosperity indicators -
980x980px

stock market chart, financial market analysis, investment growth symbol, bar chart visualization, economic trend indicator, asset valuation graph, monetary performance metric -
800x800px

Budget Investment cartoon, finance management illustration, asset allocation strategy, capital budgeting process, financial planning tools, business savings tips, economic decision-making visuals -
2000x1343px

Warren Buffett investment strategies, mutual fund market analysis, senior citizen financial planning, stock market index trends, business leadership insights, financial market expertise, investment fund management tips -
768x600px

Economy of Ukraine growth, Ukrainian financial development, investment opportunities in Ukraine, Ukrainian economic trends, financial progress visualization, wealth accumulation graph, economic prosperity indicators -
1280x1280px

Forex trading chart, stock market analysis, candlestick pattern, financial exchange, market trend visualization, investment strategy, economic data graph, png -
5461x2428px

forex trading chart, candlestick chart design, fluctuating market trends, trading backdrop, financial market analysis, stock market visualization, investment graph, png -
611x427px

Forex signal service, Foreign Exchange Market trader, investment growth chart, trading strategy analysis, financial market trends, economic data visualization, currency exchange insights -
1280x1184px

Chart, Red arrow, Stock market, Upward trend, Financial growth, Investment analysis, Market performance, png -
1987x2115px

line graph finance, blue market analysis chart, stock market trend, financial information diagram, economic growth visualization, investment performance metrics, market data analytics -
1280x905px

Trend analysis, currency fluctuations, stock market performance, trading strategies, financial market trends, investment analysis, economic indicators, png -
1000x607px

investment calculation, stock market analysis, financial transactions calculator, investment compute study, financial data visualization, portfolio management tools, economic growth charts -
600x508px

Digital marketing growth chart, SEO performance graph, NIFTY 50 business trends, stock market increase diagram, financial progress visualization, economic development metrics, market analysis infographic -
1200x1200px

Sales growth chart, business profit symbol, marketing revenue icons, purchasing analytics graph, financial success indicators, corporate earnings visualization, economic performance metrics -
1100x869px

business finance color analysis, financial data visualization, economic growth charts, investment analysis graphs, market research diagrams, strategic planning tools, wealth management insights -
900x540px

financial market analysis, LSE stock market trends, cryptocurrency investment charts, display advertising analytics, financial technology insights, market capitalization data, electronic trading platforms -
768x392px

money graphy, stock market visuals, objective finance, dollar bill, financial growth, wealth accumulation, investment opportunities -
5392x3202px

forex candlestick charts, flat business diagram, bright chart sketch, trading backdrop template, financial market analysis, stock market visualization, economic trend graph, png -
512x512px

earnings growth diagram, finance profit visual, revenue symbol chart, investment gain chart, money flow analysis, economic profit indication, capital market symbol -
5698x3447px

stock market analysis, financial growth illustration, businesswoman presenting data, upward trend chart, investment insights, economic visualization, digital finance concepts, png -
1024x856px

sales growth diagram, business strategy arrows, economic development visuals, marketing management trends, upward trend indicators, corporate success symbols, financial progress icons -
564x536px

rising financial chart, red profit graph, business growth illustration, investment performance metrics, economic trend analysis, market success visualization, corporate earnings trajectory -
1024x1024px

investment growth chart, dollar sign with upward arrow, business profit symbol, trendy finance illustration, financial success icon, economic trend visualization, wealth accumulation graphic -
1280x934px

Trend line graph, market growth chart, business trend analysis, financial growth diagram, economic progress visualization, stock market trajectory, upward trend indicator -
512x512px

candlestick chart analysis, Bollinger Bands trading, foreign exchange market trends, trader technical indicators, financial market visualization, stock chart patterns, investment strategy tools -
652x781px

finance icons financial risk, arrow and dollar symbol, image of investment growth, diagram of financial services, monetary growth visualization, digital financial trend representation, money flow graphic design -
512x512px

reduction bar chart, investment decrease, red arrow icon, economy line graph, financial trend analysis, business performance metrics, stock market visualization -
800x505px

foreign exchange market profit trends, stock trading strategies analysis, registered investment adviser financial growth, binary option price increase, investment graph performance, market trend forecast charts, finance strategy visual data -
1920x1062px

blue financial growth chart, personal finance market analysis, stock market trend diagram, market growth visualization, economic progress graph, financial data representation, investment performance metrics -
1900x1900px

Microsoft PowerPoint economy template, marketing financial analysis, service revenue growth, yellow arrow chart, business budget planning, economic data visualization, financial performance metrics -
2800x2800px

Binary option market logo, Foreign Exchange Market arrows, investment trading strategy, blue red arrow pattern, financial market trends, stock market analysis, trader decision tools -
800x600px

gold investment growth, gold coin stacks, financial market trends, interest rate impact, wealth accumulation strategy, economic stability indicators, precious metal value analysis -
3000x2200px

red arrow growth chart, business development strategy, economic growth visualization, company sales progress, financial performance metrics, strategic planning tools, market expansion trends -
4119x2412px

blue line trend chart, financial data analysis, stock market trend graph, blue abstract line plot, economic growth visualization, business performance metrics, technology trend analysis -
1000x704px

green bar chart illustration, economic growth statistics, business performance metrics, rising arrow graphic, financial progress visualization, market trend analysis, data representation chart -
1181x1181px

Day trading chart, market sentiment analysis, forex trading strategies, stock market volume, financial data visualization, investment trends graph, trading platform interface -
512x512px

dollar sign chart, sales diagram icon, market bar chart, stock market symbol, financial growth illustration, economic trend analysis, investment performance graphic -
1718x2226px

US dollar bills falling, United States currency animation, cash money objects, finance investment, wealth accumulation, economic prosperity, financial success visuals -
600x564px

economy icons, financial market analysis, economic impact diagrams, flat design economy symbols, global finance visuals, business strategy graphics, economic growth indicators -
1423x1454px

Economics Investment Growth Arrow, Real Estate Market Trends, Green Arrow Symbolizing Profit, Industry Productivity Increase, Market Expansion Visual, Financial Sector Progress, Asset Value Appreciation -
801x801px

financial recovery illustration, economic growth chart, business resurgence graphic, stock market rebound, economic progress visual, financial uptick design, market recovery concept -
1300x1600px

risk management analysis, red risk cubes, magnifying glass inspection, financial risk assessment, strategic decision tools, investment scrutiny, enterprise risk visualization -
2185x2391px

day trader silhouette, stock market analyst, business executive holding clipboard, investment professional, financial planning expert, corporate strategy consultant, economic trend analyst -
577x433px

bull market, bear market, green bull, red bear, financial trends, market indicators, investment analysis, png -
800x374px

Foreign Exchange Market analysis, price action trading strategies, trader focusing on market trends, automated trading system insights, financial market visualization, investment risk assessment, electronic trading platform interface -
1848x1703px

annual report analysis, business investment analytics, market analysis data, senior management report, financial performance metrics, corporate strategy insights, economic trend visualization -
1638x1100px

aggregate demand growth, economic innovation, hand holding arrow, turquoise economic symbol, financial progress visualization, market expansion concept, business development strategy -
1400x918px

three dimensional golden arrow up, luminous arrow background, finance growth chart, business success symbol, economic progress indicators, market analysis trends, wealth improvement visuals -
564x552px

100 dollar bill growth chart, financial success illustration, red arrow rising over money, creative dollar investment concept, wealth accumulation visual, economic progress symbol, financial prosperity graphic
