financial market trends PNG, stickers, cliparts, transparent illustration & graphics
778x647px
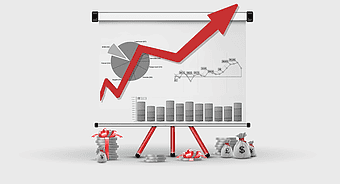
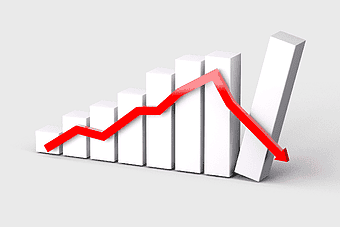
red zig zag arrow, market growth chart, stock market analysis, website branding, financial trend indicator, business performance graph, upward trajectory symbol
500x500px
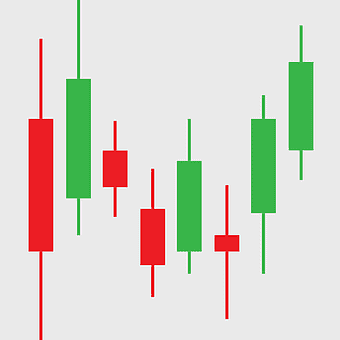
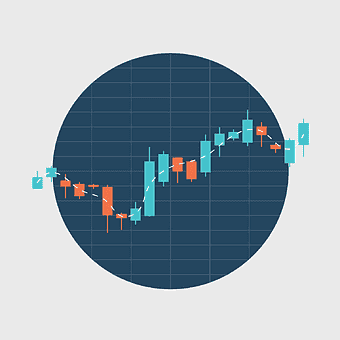
binary option trading chart, day trading financial analysis, investment market trends, stock trade visualization, candlestick chart analysis, financial market patterns, trading strategy insights
1000x710px
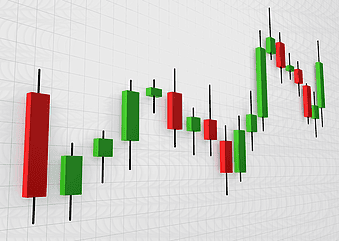
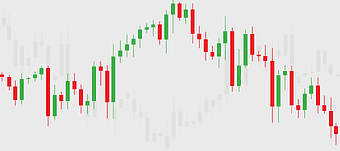
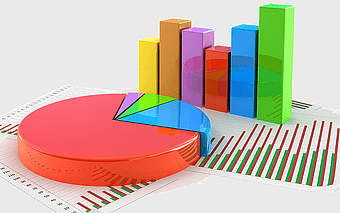
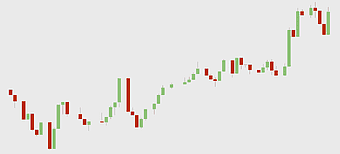
Candlestick chart pattern, Technical analysis for traders, Red and green stock bars, Open-high-low-close chart, Financial market analysis, Trading chart visualization, Stock market trend analysis
950x473px
Options strategies diagram, forex market analysis, stock trading chart, thinkorswim investment tools, candlestick pattern recognition, financial market trends, leverage trading strategies
978x595px
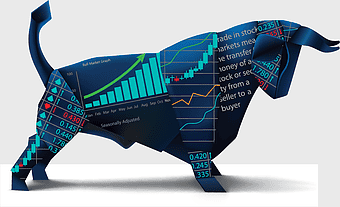
Wall Street bull market, electric blue financial charts, stock exchange investment trends, seasonal market adjustments, economic growth indicators, financial data visualization, market analysis tools
1080x792px
financial statement analysis report, management analytics chart, marketing data visualization, efficiency analysis diagram, business performance metrics, strategic financial planning, market trend analysis
5461x2428px
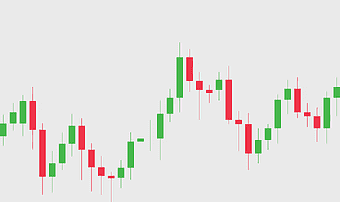
forex trading chart, candlestick chart design, fluctuating market trends, trading backdrop, financial market analysis, stock market visualization, investment graph, png
4910x3493px
stock market arrows, dynamic financial charts, sketch market trends, growth decline indicators, economic visualization, investment analysis tools, market performance graphics, png
5353x2966px
stock market arrows, flat design line chart, sketch market trends, financial growth indicators, economic data visualization, investment analysis tools, business performance metrics, png
512x512px
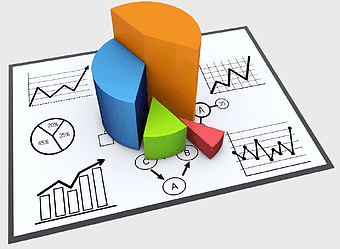
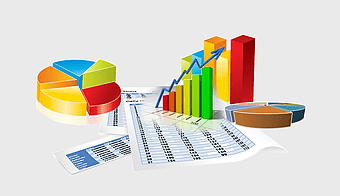
financial accounting charts, desktop office supplies, pie chart analysis, stock market statistics, business data visualization, electronic financial tools, accounting technology trends
1600x1080px
business economics, green finance, sustainable organization, economic growth, global currency symbols, financial market trends, eco-friendly business practices
611x427px
Forex signal service, Foreign Exchange Market trader, investment growth chart, trading strategy analysis, financial market trends, economic data visualization, currency exchange insights
512x512px
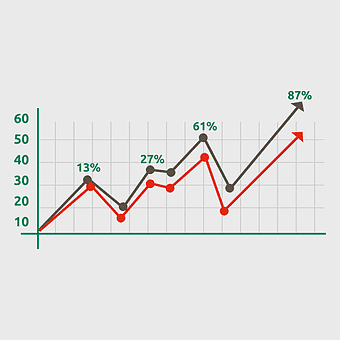
line chart data visualization, bar chart market analysis, graph trend analysis, timeline data plot, statistical infographic design, business performance metrics, financial growth chart
600x508px
Digital marketing growth chart, SEO performance graph, NIFTY 50 business trends, stock market increase diagram, financial progress visualization, economic development metrics, market analysis infographic
4119x2412px
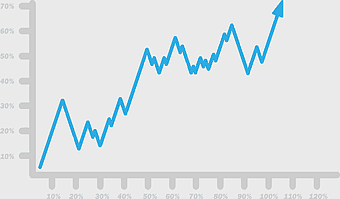
blue line trend chart, financial data analysis, stock market trend graph, blue abstract line plot, economic growth visualization, business performance metrics, technology trend analysis
1756x1762px
Arrow Market Graph, green stock market trend, upward financial chart, growth indicator, economic progress symbol, investment success graphic, positive market trajectory
2000x1343px
Warren Buffett investment strategies, mutual fund market analysis, senior citizen financial planning, stock market index trends, business leadership insights, financial market expertise, investment fund management tips
850x605px
binary option trading strategy, exchange market analysis, trader profit diagram, futures contract finance, investment growth chart, market trend visualization, financial performance metrics
740x400px
finance investment growth, stock market analysis, financial market trends, money profit diagram, economic data visualization, investment strategy chart, capital market insights
1180x458px
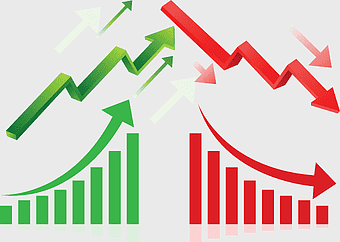
Finance market bull and bear, financial adviser investment strategies, asset management trends, stock market analysis, economic indicators visualization, financial planning tools, market performance graphics
5392x3202px
forex candlestick charts, flat business diagram, bright chart sketch, trading backdrop template, financial market analysis, stock market visualization, economic trend graph, png
5508x2689px
forex trading chart, bright candlestick sketch, flat forex backdrop, candlestick chart design, financial market analysis, trading strategy visuals, stock market trends, png
502x549px
real estate investment, mortgage loan funding, property cash savings, home equity finance, real estate market trends, financial planning strategies, investment property analysis
800x505px
foreign exchange market profit trends, stock trading strategies analysis, registered investment adviser financial growth, binary option price increase, investment graph performance, market trend forecast charts, finance strategy visual data
2251x1352px
saving trends, investment growth, gold coin stacks, economic development, financial progress visualization, wealth accumulation process, market prosperity indicators
1024x1024px
banknote and coins, economic growth diagram, economics and supply, stack of gold coins, financial market trends, global economic systems, currency scale commentary
1280x1280px
Forex trading chart, stock market analysis, candlestick pattern, financial exchange, market trend visualization, investment strategy, economic data graph, png
1280x934px
Trend line graph, market growth chart, business trend analysis, financial growth diagram, economic progress visualization, stock market trajectory, upward trend indicator
598x500px
3D computer statistics visualization, laptop with financial charts, business research data analysis, stock market trend graphs, financial growth metrics, data-driven decision making, technology-driven business insights
900x540px
financial market analysis, LSE stock market trends, cryptocurrency investment charts, display advertising analytics, financial technology insights, market capitalization data, electronic trading platforms
1440x1256px
Foreign Exchange Market Chart, day trading software, technical analysis diagram, electronic trading platform, financial market analysis, investment strategy visualization, currency exchange trends
1280x1280px
Bull Market, Stock Trading, Share Price Rise, Profit Gain, Market Trend, Investment Growth, Financial Success, png
1280x853px
Recession graph, market crash diagram, economic downturn visualization, volatile financial trends, financial crisis analysis, investment risk depiction, economic instability illustration, png
1280x1184px
Chart, Red arrow, Stock market, Upward trend, Financial growth, Investment analysis, Market performance, png
1592x1194px
business growth chart, conversion rate optimization, digital marketing graph, interest rate trends, financial progress visualization, economic development metrics, performance analysis chart
1987x2115px
line graph finance, blue market analysis chart, stock market trend, financial information diagram, economic growth visualization, investment performance metrics, market data analytics
4549x2455px
polygon buffalo bear, candlestick chart, stock trading design, low sketch, financial market symbols, geometric animal figures, market trend indicators, png
1280x905px
Trend analysis, currency fluctuations, stock market performance, trading strategies, financial market trends, investment analysis, economic indicators, png
501x501px
foreign exchange market trends, day trading performance graph, commodity trading advisor logo, automated trading system icon, financial market growth chart, trading analytics symbol, investment strategy icon
1280x853px
economic recession graph, stock market crash diagram, financial volatility chart, economic downturn visualization, financial crisis trends, investment risk analysis, market performance decline, png
1024x856px
sales growth diagram, business strategy arrows, economic development visuals, marketing management trends, upward trend indicators, corporate success symbols, financial progress icons
954x550px
big data analysis, business analytics trends, data science graphs, predictive analytics charts, market research visuals, financial reporting diagrams, corporate performance metrics
800x500px
business statistics analysis, management data visualization, business intelligence charts, organization performance metrics, financial trend analysis, market research graphs, data-driven decision making
577x433px
bull market, bear market, green bull, red bear, financial trends, market indicators, investment analysis, png
1000x704px
green bar chart illustration, economic growth statistics, business performance metrics, rising arrow graphic, financial progress visualization, market trend analysis, data representation chart
1181x1181px
Day trading chart, market sentiment analysis, forex trading strategies, stock market volume, financial data visualization, investment trends graph, trading platform interface
3333x2500px
Graph of a function, market growth chart, bar chart visualization, stock market statistics, data representation diagram, financial trend analysis, business performance metrics
4181x3936px
stock market bull, bull market trend, golden bull symbol, upward market arrow, financial growth indicator, economic prosperity icon, investment optimism sign, png
512x512px
supply and demand graph, economic system analysis, yellow coins stack, green money bundles, financial growth chart, market economy trends, wealth accumulation icons
980x980px
stock market chart, financial market analysis, investment growth symbol, bar chart visualization, economic trend indicator, asset valuation graph, monetary performance metric
512x512px
bar chart statistics, business statistics icons, yellow bar chart, line chart diagram, data visualization graphics, financial growth trends, market analysis visuals
960x640px
growth arrow illustration, business success strategy, startup progress chart, social media marketing trends, upward trajectory symbol, professional development journey, financial growth trajectory
800x374px
Foreign Exchange Market analysis, price action trading strategies, trader focusing on market trends, automated trading system insights, financial market visualization, investment risk assessment, electronic trading platform interface
1646x745px
algorithmic trading strategies, quantitative analyst tools, automated trading systems, electronic trading platforms, financial market analysis, stock market trends visualization, high-frequency trading techniques
564x536px
rising financial chart, red profit graph, business growth illustration, investment performance metrics, economic trend analysis, market success visualization, corporate earnings trajectory
1349x1110px
red decline arrow, financial trend analysis, business graph illustration, economic crisis symbol, market downturn visualization, negative growth chart, recession impact diagram
680x578px
3D bar graph finance, service trade chart, cargo business analysis, material price rise, financial growth visualization, economic data representation, market trend illustration
3000x2200px
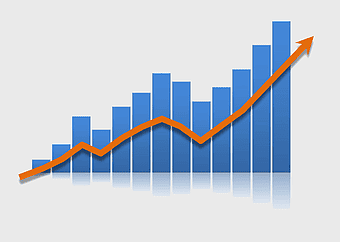
red arrow growth chart, business development strategy, economic growth visualization, company sales progress, financial performance metrics, strategic planning tools, market expansion trends
800x600px
gold investment growth, gold coin stacks, financial market trends, interest rate impact, wealth accumulation strategy, economic stability indicators, precious metal value analysis
512x512px
candlestick chart analysis, Bollinger Bands trading, foreign exchange market trends, trader technical indicators, financial market visualization, stock chart patterns, investment strategy tools


