stock market PNG, stickers, cliparts, transparent illustration & graphics
1000x710px
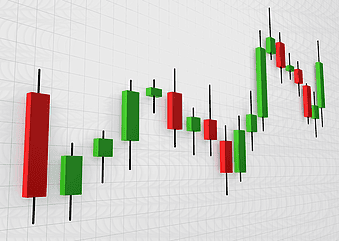
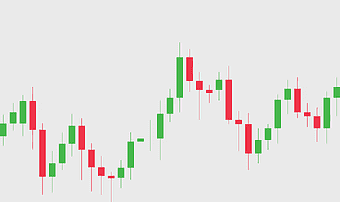
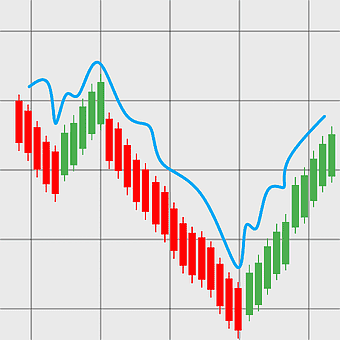
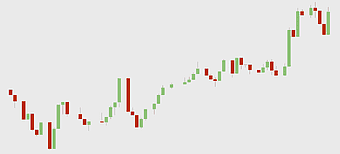
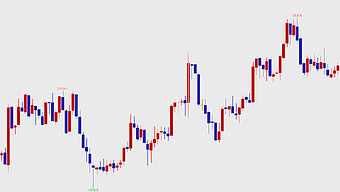
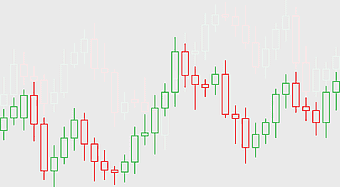
Candlestick chart pattern, Technical analysis for traders, Red and green stock bars, Open-high-low-close chart, Financial market analysis, Trading chart visualization, Stock market trend analysis
778x647px
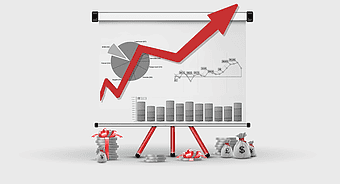
red zig zag arrow, market growth chart, stock market analysis, website branding, financial trend indicator, business performance graph, upward trajectory symbol
950x473px
Options strategies diagram, forex market analysis, stock trading chart, thinkorswim investment tools, candlestick pattern recognition, financial market trends, leverage trading strategies
500x500px
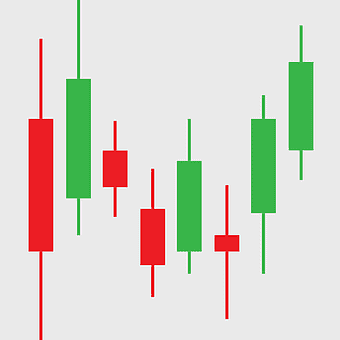
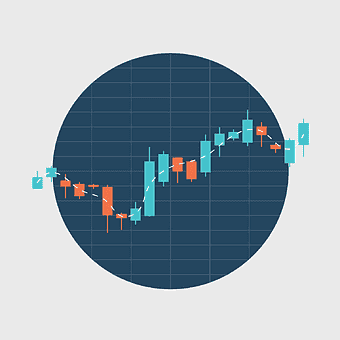
binary option trading chart, day trading financial analysis, investment market trends, stock trade visualization, candlestick chart analysis, financial market patterns, trading strategy insights
5461x2428px
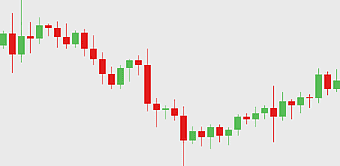
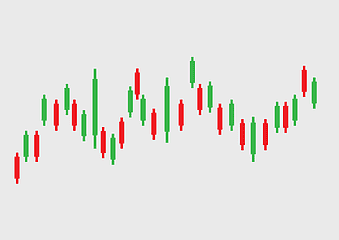
forex trading chart, candlestick chart design, fluctuating market trends, trading backdrop, financial market analysis, stock market visualization, investment graph, png
4910x3493px
stock market arrows, dynamic financial charts, sketch market trends, growth decline indicators, economic visualization, investment analysis tools, market performance graphics, png
5353x2966px
stock market arrows, flat design line chart, sketch market trends, financial growth indicators, economic data visualization, investment analysis tools, business performance metrics, png
978x595px
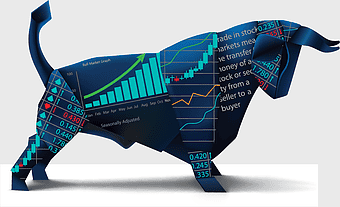
Wall Street bull market, electric blue financial charts, stock exchange investment trends, seasonal market adjustments, economic growth indicators, financial data visualization, market analysis tools
1004x747px
white and black bull illustration, Charging Bull Drawing, bull logo, monochrome wildlife art, aggressive animal stance, powerful mammal graphic, stock market symbol
600x508px
Digital marketing growth chart, SEO performance graph, NIFTY 50 business trends, stock market increase diagram, financial progress visualization, economic development metrics, market analysis infographic
1756x1762px
Arrow Market Graph, green stock market trend, upward financial chart, growth indicator, economic progress symbol, investment success graphic, positive market trajectory
740x400px
finance investment growth, stock market analysis, financial market trends, money profit diagram, economic data visualization, investment strategy chart, capital market insights
5392x3202px
forex candlestick charts, flat business diagram, bright chart sketch, trading backdrop template, financial market analysis, stock market visualization, economic trend graph, png
5508x2689px
forex trading chart, bright candlestick sketch, flat forex backdrop, candlestick chart design, financial market analysis, trading strategy visuals, stock market trends, png
600x554px
profit growth, saving money, finance chart, stock market returns, wealth accumulation, financial progress, investment gains
512x512px
financial accounting charts, desktop office supplies, pie chart analysis, stock market statistics, business data visualization, electronic financial tools, accounting technology trends
998x612px
financial accounting services, bank loan management, electronic bookkeeping tools, stock market analysis, financial data visualization, business analytics dashboard, accounting software interface
1280x1280px
Forex trading chart, stock market analysis, candlestick pattern, financial exchange, market trend visualization, investment strategy, economic data graph, png
1414x1414px
coming soon banner, red angle sign, upcoming event logo, stock image text, promotional graphic design, digital marketing icon, website update notification
2000x1343px
Warren Buffett investment strategies, mutual fund market analysis, senior citizen financial planning, stock market index trends, business leadership insights, financial market expertise, investment fund management tips
768x392px
money graphy, stock market visuals, objective finance, dollar bill, financial growth, wealth accumulation, investment opportunities
500x500px
red arrow options strategies, trader trading strategy market, red arrow finance diagram, stock market profit indicator, upward trend analysis, investment growth symbol, market performance visualization
1180x458px
Finance market bull and bear, financial adviser investment strategies, asset management trends, stock market analysis, economic indicators visualization, financial planning tools, market performance graphics
1987x2115px
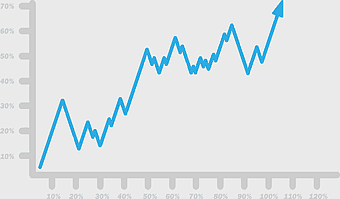
line graph finance, blue market analysis chart, stock market trend, financial information diagram, economic growth visualization, investment performance metrics, market data analytics
1280x1280px
Bull Market, Stock Trading, Share Price Rise, Profit Gain, Market Trend, Investment Growth, Financial Success, png
1280x1184px
Chart, Red arrow, Stock market, Upward trend, Financial growth, Investment analysis, Market performance, png
4549x2455px
polygon buffalo bear, candlestick chart, stock trading design, low sketch, financial market symbols, geometric animal figures, market trend indicators, png
1181x1181px
Day trading chart, market sentiment analysis, forex trading strategies, stock market volume, financial data visualization, investment trends graph, trading platform interface
4181x3936px
stock market bull, bull market trend, golden bull symbol, upward market arrow, financial growth indicator, economic prosperity icon, investment optimism sign, png
6451x3917px
stock market investor, buy sign, sell sign, candlestick chart, financial decision making, trading strategy, market analysis, png
512x512px
finance market icons, selling food tags, stock market diagram, payment logo, green finance visuals, eco-friendly business symbols, capital market branding
3333x2500px
Graph of a function, market growth chart, bar chart visualization, stock market statistics, data representation diagram, financial trend analysis, business performance metrics
980x980px
stock market chart, financial market analysis, investment growth symbol, bar chart visualization, economic trend indicator, asset valuation graph, monetary performance metric
900x540px
financial market analysis, LSE stock market trends, cryptocurrency investment charts, display advertising analytics, financial technology insights, market capitalization data, electronic trading platforms
1000x762px
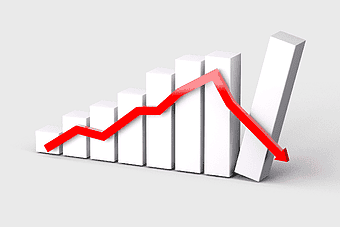
financial crisis 2007-2008, red down arrow, stock market decline, business downturn, economic recession graphic, financial decline illustration, monetary crisis diagram
3000x2500px
logo design, bear market, bull market, stock market trends, financial symbols, market analysis, investment icons, png
800x505px
foreign exchange market profit trends, stock trading strategies analysis, registered investment adviser financial growth, binary option price increase, investment graph performance, market trend forecast charts, finance strategy visual data
1646x745px
algorithmic trading strategies, quantitative analyst tools, automated trading systems, electronic trading platforms, financial market analysis, stock market trends visualization, high-frequency trading techniques
1280x905px
Trend analysis, currency fluctuations, stock market performance, trading strategies, financial market trends, investment analysis, economic indicators, png
4119x2412px
blue line trend chart, financial data analysis, stock market trend graph, blue abstract line plot, economic growth visualization, business performance metrics, technology trend analysis
1280x853px
economic recession graph, stock market crash diagram, financial volatility chart, economic downturn visualization, financial crisis trends, investment risk analysis, market performance decline, png
2200x2014px
Hang Seng Index decline, red arrows stock market crash, market capitalization drop, SSE Composite Index fall, financial market downturn, economic indicator fall, investment risk visualization
512x512px
candlestick chart analysis, Bollinger Bands trading, foreign exchange market trends, trader technical indicators, financial market visualization, stock chart patterns, investment strategy tools
512x512px
dollar sign chart, sales diagram icon, market bar chart, stock market symbol, financial growth illustration, economic trend analysis, investment performance graphic
1280x934px
Trend line graph, market growth chart, business trend analysis, financial growth diagram, economic progress visualization, stock market trajectory, upward trend indicator
598x500px
3D computer statistics visualization, laptop with financial charts, business research data analysis, stock market trend graphs, financial growth metrics, data-driven decision making, technology-driven business insights
2800x2800px
Binary option market logo, Foreign Exchange Market arrows, investment trading strategy, blue red arrow pattern, financial market trends, stock market analysis, trader decision tools
1920x909px
market index trends, stock market performance, investment growth analysis, market capitalization graph, financial chart visualization, economic data representation, trading indicator analysis
650x814px
world smile day real estate sales, smiling woman advertising stock, human expression of joy, face with cheerful thumbs up, enthusiastic person shout of triumph, excited promotional realtor, market segmentation success illustration
1024x541px
market stall setup, advertising strategy for farmers, marketing mix for trade, wooden crate stock, artisanal goods display, eco-friendly marketplace visuals, rustic selling booth design
1280x1280px
Bear Market, Stock Market Decline, Red Bear Icon, Share Price Drop, Financial Downturn, Economic Recession, Investment Losses, png
660x672px
binoculars, businessperson looking through binoculars, stock market analysis, telescope for business, professional vision tools, strategic planning equipment, financial foresight instruments
512x512px
investment market documents, exchange brand logo, financial transaction materials, market liquidity tags, document signing process, investment planning tools, stock market analysis
1920x1062px
blue financial growth chart, personal finance market analysis, stock market trend diagram, market growth visualization, economic progress graph, financial data representation, investment performance metrics
801x801px
financial recovery illustration, economic growth chart, business resurgence graphic, stock market rebound, economic progress visual, financial uptick design, market recovery concept
1000x893px
financial accounting tools, bookkeeping essentials, stock market analysis, statistic visualization, financial management software, accounting data visualization, business finance tools
640x473px
frustrated financial advisor, stock market trader stress, business management challenges, technical analysis difficulties, corporate communication issues, professional burnout, investment strategy setbacks
5698x3447px
stock market analysis, financial growth illustration, businesswoman presenting data, upward trend chart, investment insights, economic visualization, digital finance concepts, png
1260x712px
retail foreign exchange trading, share price analysis, money order diagram, trader income statement, financial market trends, stock market visualization, economic data chart
5387x2962px
forex candlestick charts, flat diagram outline, trading backdrop, candlestick analysis, financial market trends, stock chart patterns, investment strategy tools, png


